

Question: 100% ? Q Search in Document Layout Document Elements Tables Charts Review a A Home SmartArt Insert Chart Data Chart Quick Layouts Chart Styles Column
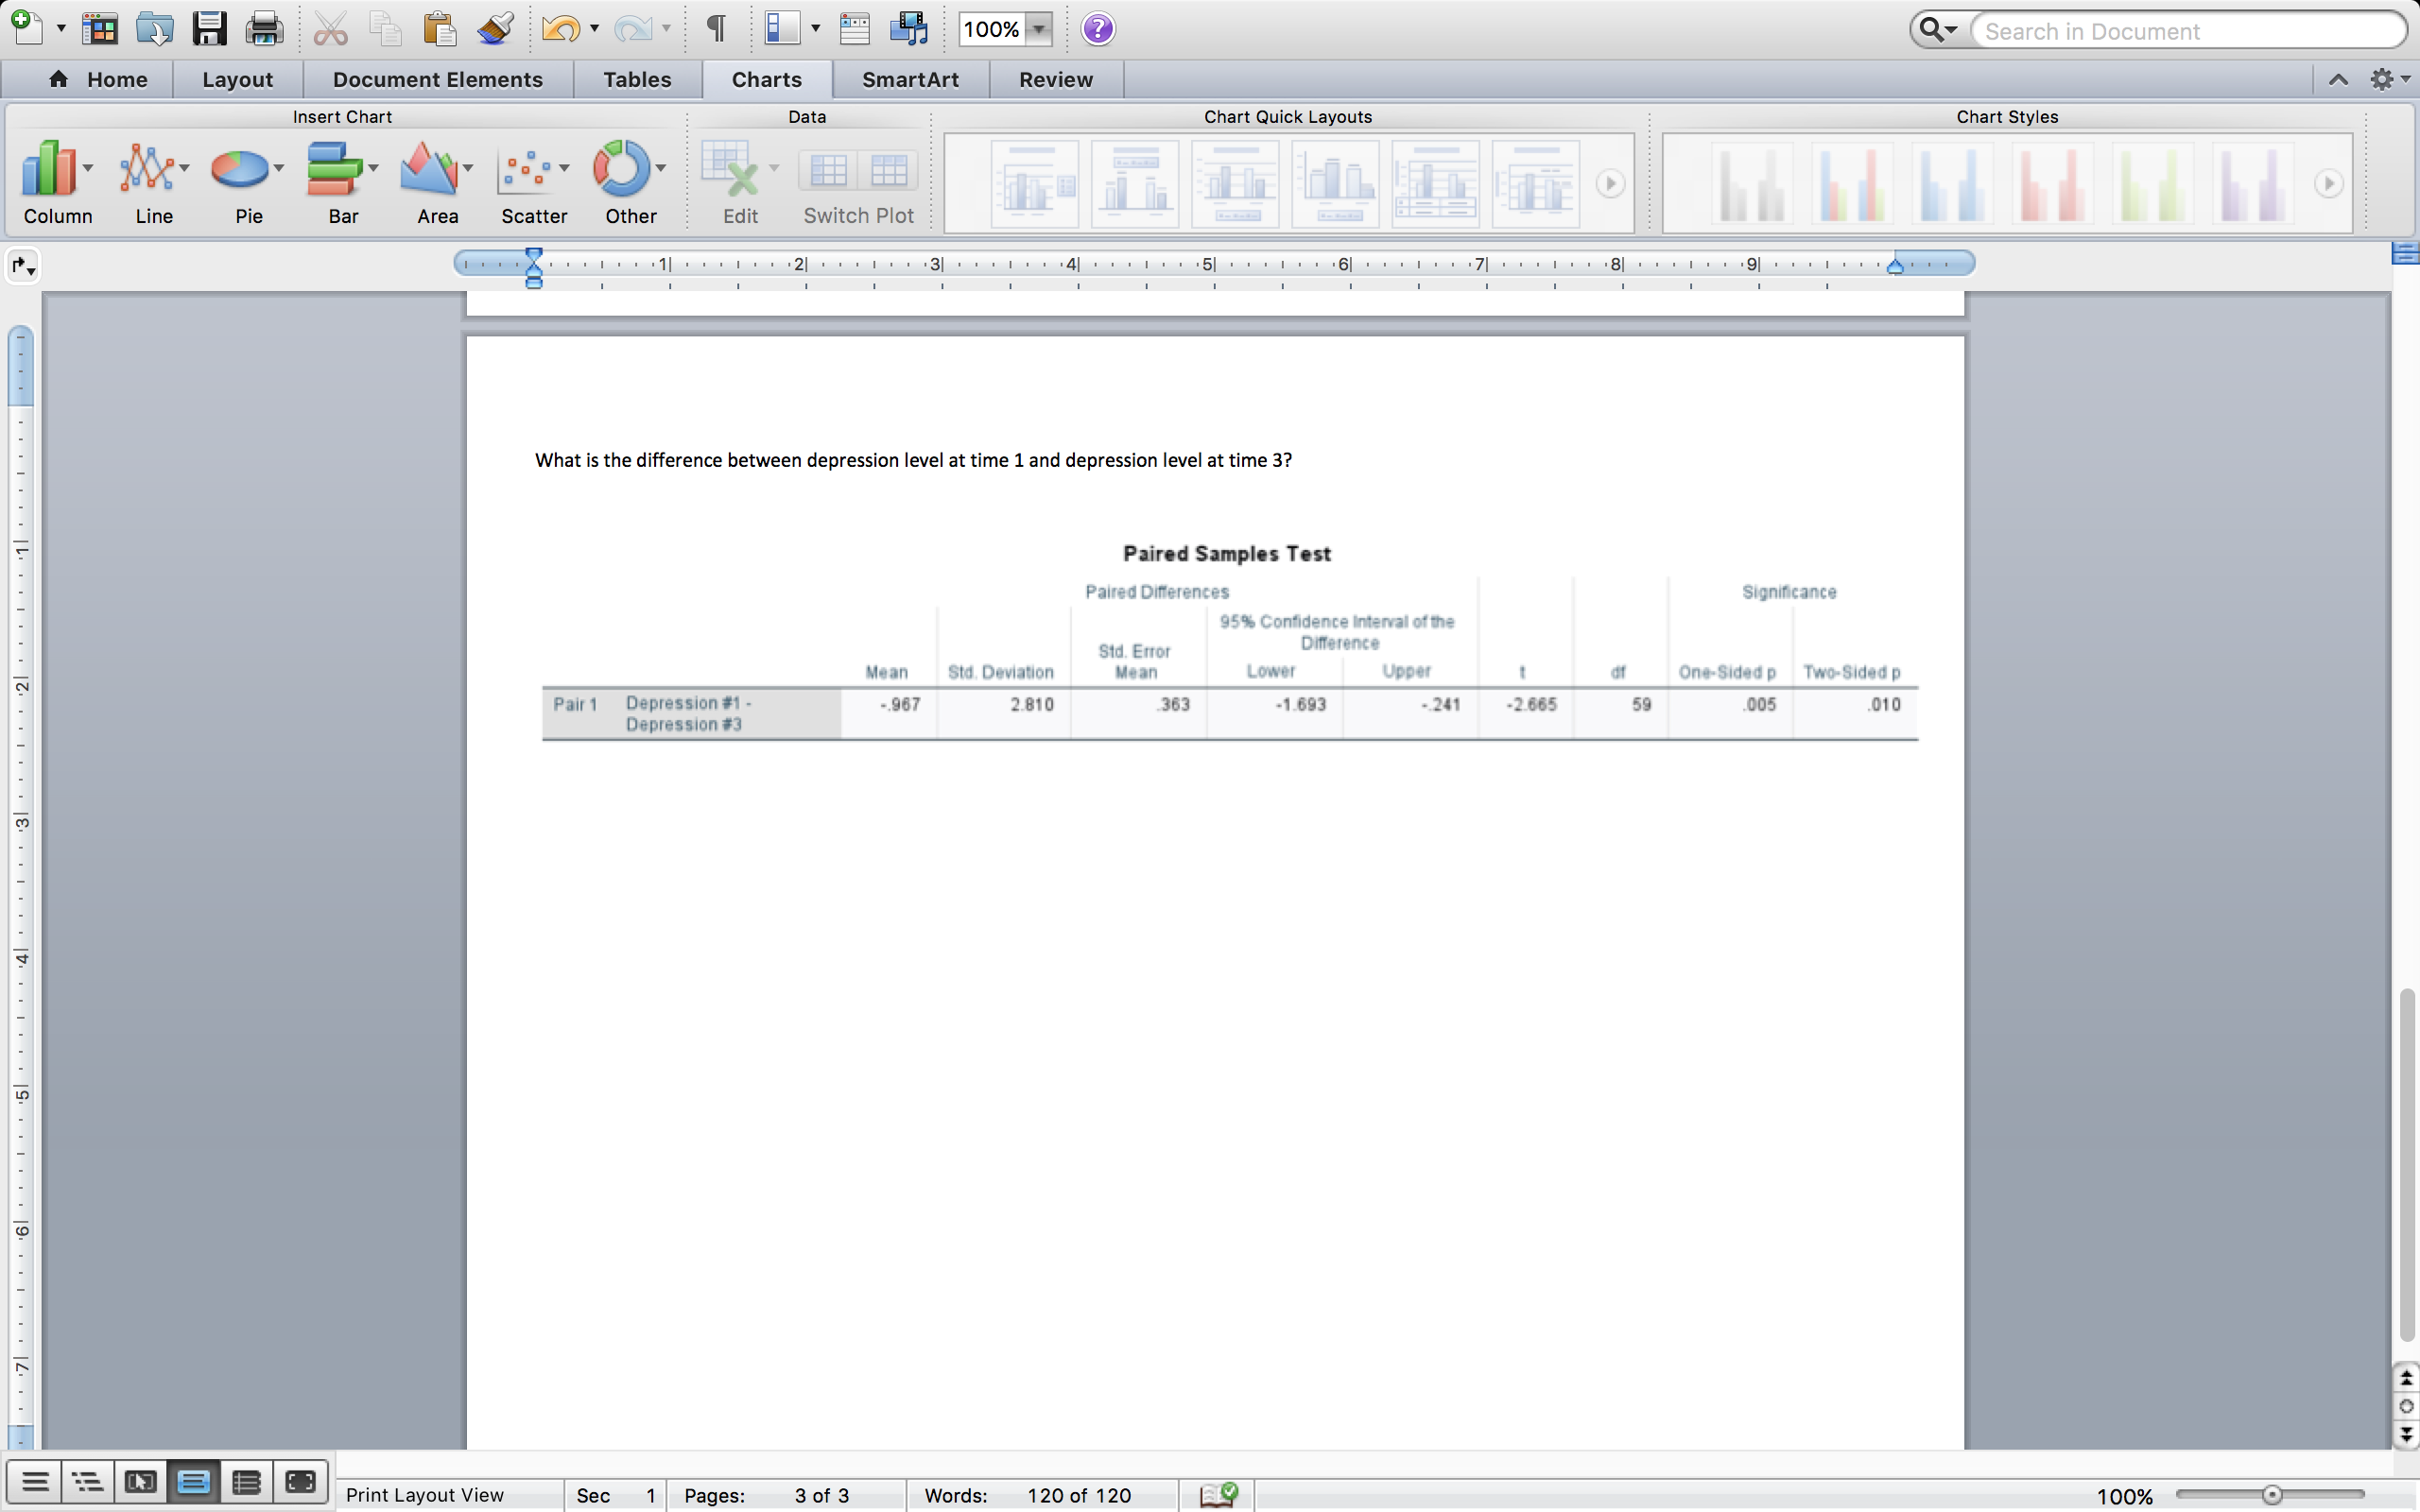
100% ? Q Search in Document Layout Document Elements Tables Charts Review a A Home SmartArt Insert Chart Data Chart Quick Layouts Chart Styles Column Line Pie Bar Area Scatter Other Edit Switch Plot What is the difference between depression level at time 1 and depression level at time 3? Paired Samples Test Paired Differences Significance 95% Confidence Interval of the Std. Error Difference Mean Std. Deviation Mean Lower Upper of One-Sided p Two-Sided p Pair 1 Depression #1 - -.967 2.810 363 -1.693 - 241 -2.665 59 005 .010 Depression #3 Print Layout View Sec 1 Pages: 3 of 3 Words: 120 of 120 100%
Step by Step Solution
There are 3 Steps involved in it
1 Expert Approved Answer
Step: 1 Unlock

Question Has Been Solved by an Expert!
Get step-by-step solutions from verified subject matter experts
Step: 2 Unlock
Step: 3 Unlock