

Question: 11. (10 points) Using the regression model estimated in Question 9, calculate the predicted values of InCO2 for a range of InGDP observed in the
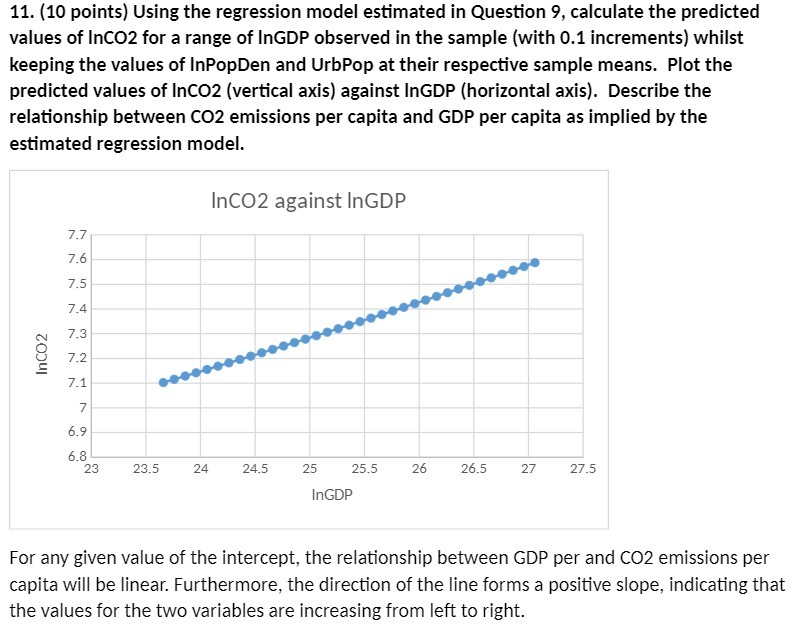
11. (10 points) Using the regression model estimated in Question 9, calculate the predicted values of InCO2 for a range of InGDP observed in the sample (with 0.1 increments) whilst keeping the values of InPopDen and UrbPop at their respective sample means. Plot the predicted values of InCO2 (vertical axis) against InGDP (horizontal axis). Describe the relationship between CO2 emissions per capita and GDP per capita as implied by the estimated regression model. InCO2 against InGDP 7.7 7.6 7.5 7.4 InCO2 7.3 7.2 7.1 7 6.9 6.8 23 23.5 24 24.5 25 25.5 26 26.5 27 27.5 InGDP For any given value of the intercept, the relationship between GDP per and CO2 emissions per capita will be linear. Furthermore, the direction of the line forms a positive slope, indicating that the values for the two variables are increasing from left to right
Step by Step Solution
There are 3 Steps involved in it

Get step-by-step solutions from verified subject matter experts