

Question: 1.1 1.0 TR = 2.00 0.9 TR = 1.50 9 0.8 RT 0.7 | 9 11 TR = 1.30 2 RT Z = 0.6 TR


![textbook. Also provide the units for each of the variables described. [8]](https://dsd5zvtm8ll6.cloudfront.net/si.experts.images/questions/2024/09/66f02597abf19_29566f0259759473.jpg)
![your steps and explain how the values were obtained [6] 1.4 How](https://dsd5zvtm8ll6.cloudfront.net/si.experts.images/questions/2024/09/66f02598b4994_29666f025985f041.jpg)
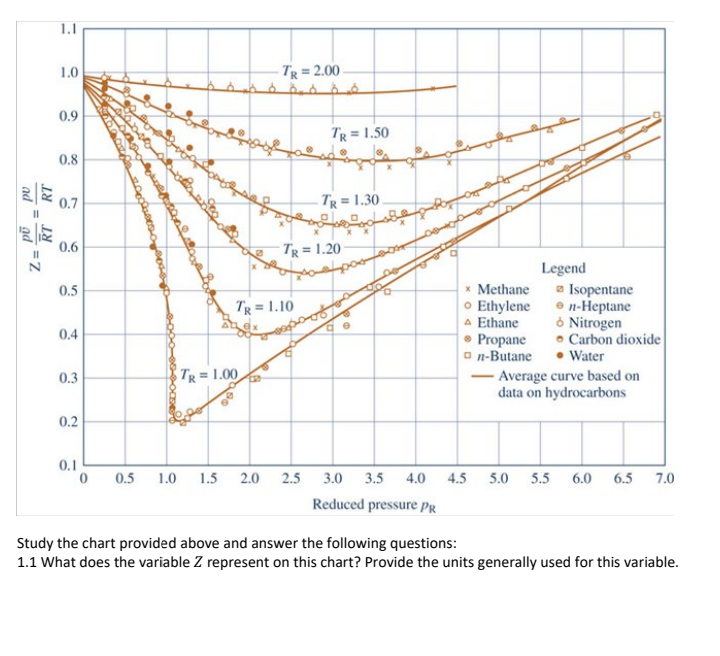
1.1 1.0 TR = 2.00 0.9 TR = 1.50 9 0.8 RT 0.7 | 9 11 TR = 1.30 2 RT Z = 0.6 TR = 1.20 0.5 TR = 1.10 0.4 Legend * Methane Isopentane Ethylene en-Heptane A Ethane Nitrogen Propane Carbon dioxide on-Butane Water - Average curve based on data on hydrocarbons 0.3 TR = 1.00 " 0.2 0.1 0 0.5 1.0 1.5 2.0 2.5 4.5 5.0 5.5 6.0 6.5 7.0 3.0 3.5 4.0 Reduced pressure PR Study the chart provided above and answer the following questions: 1.1 What does the variable Z represent on this chart? Provide the units generally used for this variable. 1.2 What do the variables PR and TR represent and how are they calculated? Identify and explain the variables used in these calculations and explain where the values for these variables can be found in your textbook. Also provide the units for each of the variables described. [8] 1.3 Given Ethylene at 38.85C and 10 300 kPa, determine Z. Show your steps and explain how the values were obtained [6] 1.4 How were the solid lines representing Tr values originally obtained to create this chart? [1] 1.5 What observation can you make regarding how the different Tr lines vary? [1] 1.6 What observation can you make about the variable Pr as the variable Z approaches 1? 1 [1] 2. If PR = 0.1, determine the p values for: [2] 2.1. Propane 2.2. Carbon monoxide [2] 2.3. Nitrogen [2] 2.4. Water vapour [2] 2.6. What assumption can be made about the compressibility factor Z when the pressure p is small relative to the critical pressure pc? [1] 3. What assumption can be made in cases where the compressibility factor for a substance approximates to 1? [1] 4. 3.5 kg of Propane in a rigid tank at 4000 kPa, 110C is heated to 130C. 4.1. Determine the initial volume in the tank, in m?, using data from the compressibility chart. [6] 4.2. Determine the initial volume in the tank, in m', using data from the thermodynamic tables. [2] 4.3. Calculate the percentage error between your results from (4.1) and (4.2). [2] 4.4. Explain what these results mean. Indicate whether the ideal gas law can be used in this scenario for Propane using a calculation and comparing the answer to the answer you found in (4.2). (4] [
Step by Step Solution
There are 3 Steps involved in it

Get step-by-step solutions from verified subject matter experts