

Question: 11. Based on the profits computed in step 10, which is the best performing region in terms of profit, and what were the quarterly profits
11. Based on the profits computed in step 10, which is the best performing region in terms of profit, and what were the quarterly profits for that region?
12. Based on the profits computed in step 10, which is the best performing store in terms of profit, and what were the profits for that store?
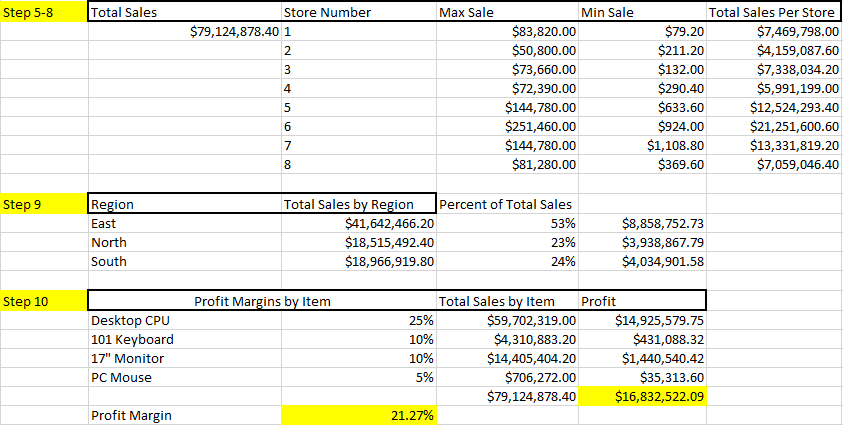
Step 5-8 Total Sales Max Sale Store Number $79,124,878.40 1 2 w N 3 4 Min Sale $83,820.00 $50,800.00 $73,660.00 $72,390.00 $144,780.00 $251,460.00 $144,780.00 $81,280.00 Total Sales Per Store $79.20 $7,469,798.00 $211.20 $4,159,087.60 $132.00 $7,338,034.20 $290.40 $5,991,199.00 $633.60 $12,524,293.40 $924.00 $21,251,600.60 $1,108.80 $13,331,819.20 $369.60 $7,059,046.40 5 6 7 8 Step 9 Region East North South Total Sales by Region Percent of Total Sales $41,642,466.20 53% $18,515,492.40 23% $18,966,919.80 24% $8,858,752.73 $3,938,867.79 $4,034,901.58 Step 10 Profit Margins by Item Desktop CPU 101 Keyboard 17" Monitor PC Mouse Total Sales by Item Profit 25% $59,702,319.00 $14,925,579.75 10% $4,310,883.20 $431,088.32 10% $14,405,404.20 $1,440,540.42 5% $706,272.00 $35,313.60 $79,124,878.40 $16,832,522.09 21.27% Profit Margin
Step by Step Solution
There are 3 Steps involved in it

Get step-by-step solutions from verified subject matter experts