

Question: 11. Based on the profits computed in step 10, which is the best performing region in terms of profit, and what were the quarterly profits
11. Based on the profits computed in step 10, which is the best performing region in terms of profit, and what were the quarterly profits for that region?
12. Based on the profits computed in step 10, which is the best performing store in terms of profit, and what were the profits for that store?
13. Suppose we are able to increase our profit margins so that the new profit margins are indicated as follows: desktop CPU (or laptop) profit margin is 26%, 101 keyboards profit margin is 15%, 17'' monitor is 15%, pc mouse is 15%. What is the new profit amount? Compared to the profit you computed in Step 10, how much (in dollar figures as well as in percentage of change) does our total profit increase? Percentage of change from the original value to the new value is computed as follows.
Percentage of change =(New Value Original Value)*100/(Original Value)[Math Processing Error]
14. Based on total quarterly sales, what percentage of total sales does each region contribute?
15. Based on total quarterly sales, what percentage of total sales does each store contribute?
16. What are the total sales by month? Submit your answer on a separate worksheet.
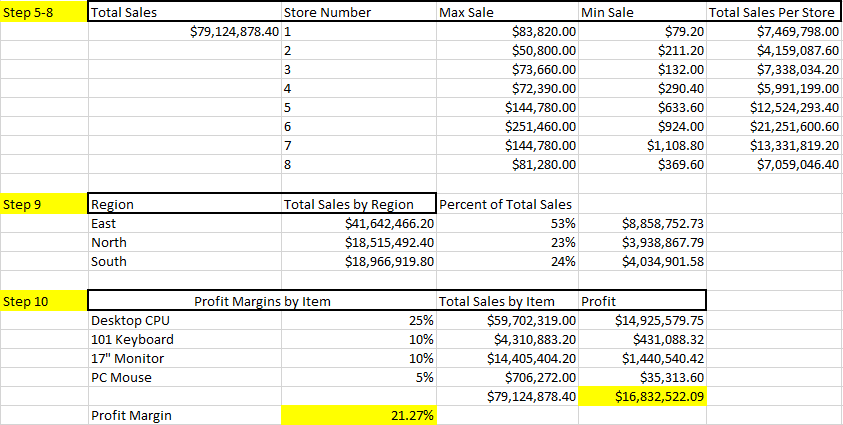
Step 5-8 Total Sales Max Sale Store Number $79,124,878.40 1 2 w N 4 Min Sale $83,820.00 $50,800.00 $73,660.00 $72,390.00 $144,780.00 $251,460.00 $144,780.00 $81,280.00 Total Sales Per Store $79.20 $7,469,798.00 $211.20 $4,159,087.60 $132.00 $7,338,034.20 $290.40 $5,991,199.00 $633.60 $12,524,293.40 $924.00 $21,251,600.60 $1,108.80 $13,331,819.20 $369.60 $7,059,046.40 5 6 7 8 Step 9 Region East North South Total Sales by Region Percent of Total Sales $41,642,466.20 53% $18,515,492.40 23% $18,966,919.80 24% $8,858,752.73 $3,938,867.79 $4,034,901.58 Step 10 Profit Margins by Item Desktop CPU 101 Keyboard 17" Monitor PC Mouse Total Sales by Item Profit 25% $59,702,319.00 $14,925,579.75 10% $4,310,883.20 $431,088.32 10% $14,405,404.20 $1,440,540.42 5% $706,272.00 $35,313.60 $79,124,878.40 $16,832,522.09 21.27% Profit Margin Step 5-8 Total Sales Max Sale Store Number $79,124,878.40 1 2 w N 4 Min Sale $83,820.00 $50,800.00 $73,660.00 $72,390.00 $144,780.00 $251,460.00 $144,780.00 $81,280.00 Total Sales Per Store $79.20 $7,469,798.00 $211.20 $4,159,087.60 $132.00 $7,338,034.20 $290.40 $5,991,199.00 $633.60 $12,524,293.40 $924.00 $21,251,600.60 $1,108.80 $13,331,819.20 $369.60 $7,059,046.40 5 6 7 8 Step 9 Region East North South Total Sales by Region Percent of Total Sales $41,642,466.20 53% $18,515,492.40 23% $18,966,919.80 24% $8,858,752.73 $3,938,867.79 $4,034,901.58 Step 10 Profit Margins by Item Desktop CPU 101 Keyboard 17" Monitor PC Mouse Total Sales by Item Profit 25% $59,702,319.00 $14,925,579.75 10% $4,310,883.20 $431,088.32 10% $14,405,404.20 $1,440,540.42 5% $706,272.00 $35,313.60 $79,124,878.40 $16,832,522.09 21.27% Profit Margin
Step by Step Solution
There are 3 Steps involved in it

Get step-by-step solutions from verified subject matter experts