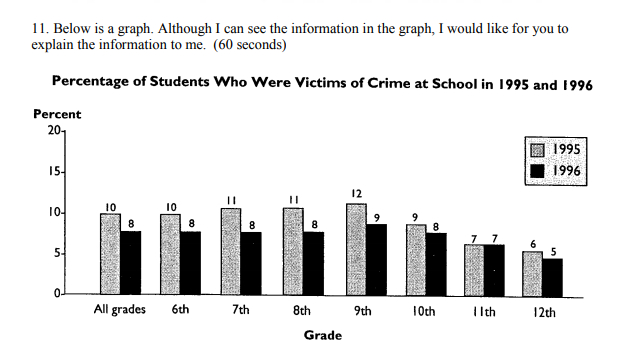
Question: 11. Below is a graph. Although I can see the information in the graph, I would like for you to explain the information to me.

11. Below is a graph. Although I can see the

11. Below is a graph. Although I can see the information in the graph, I would like for you to explain the information to me. (60 seconds) Percentage of Students Who Were Victims of Crime at School in 1995 and 1996 Percent 201 1995 1996 15- 12 10- 10 10 8 8 8 8 5- 5 0- All grades 6th 7th 8th 9th 10th Ilth 12th Grade

Step by Step Solution

There are 3 Steps involved in it

1 Expert Approved Answer
Step: 1 Unlock blur-text-image
Question Has Been Solved by an Expert!

Get step-by-step solutions from verified subject matter experts

Step: 2 Unlock
Step: 3 Unlock

Students Have Also Explored These Related General Management Questions!