

Question: 11. Each quadratic function is given in standard form, y = ax2 + bx + c. Complete the table. What in the equation tells you
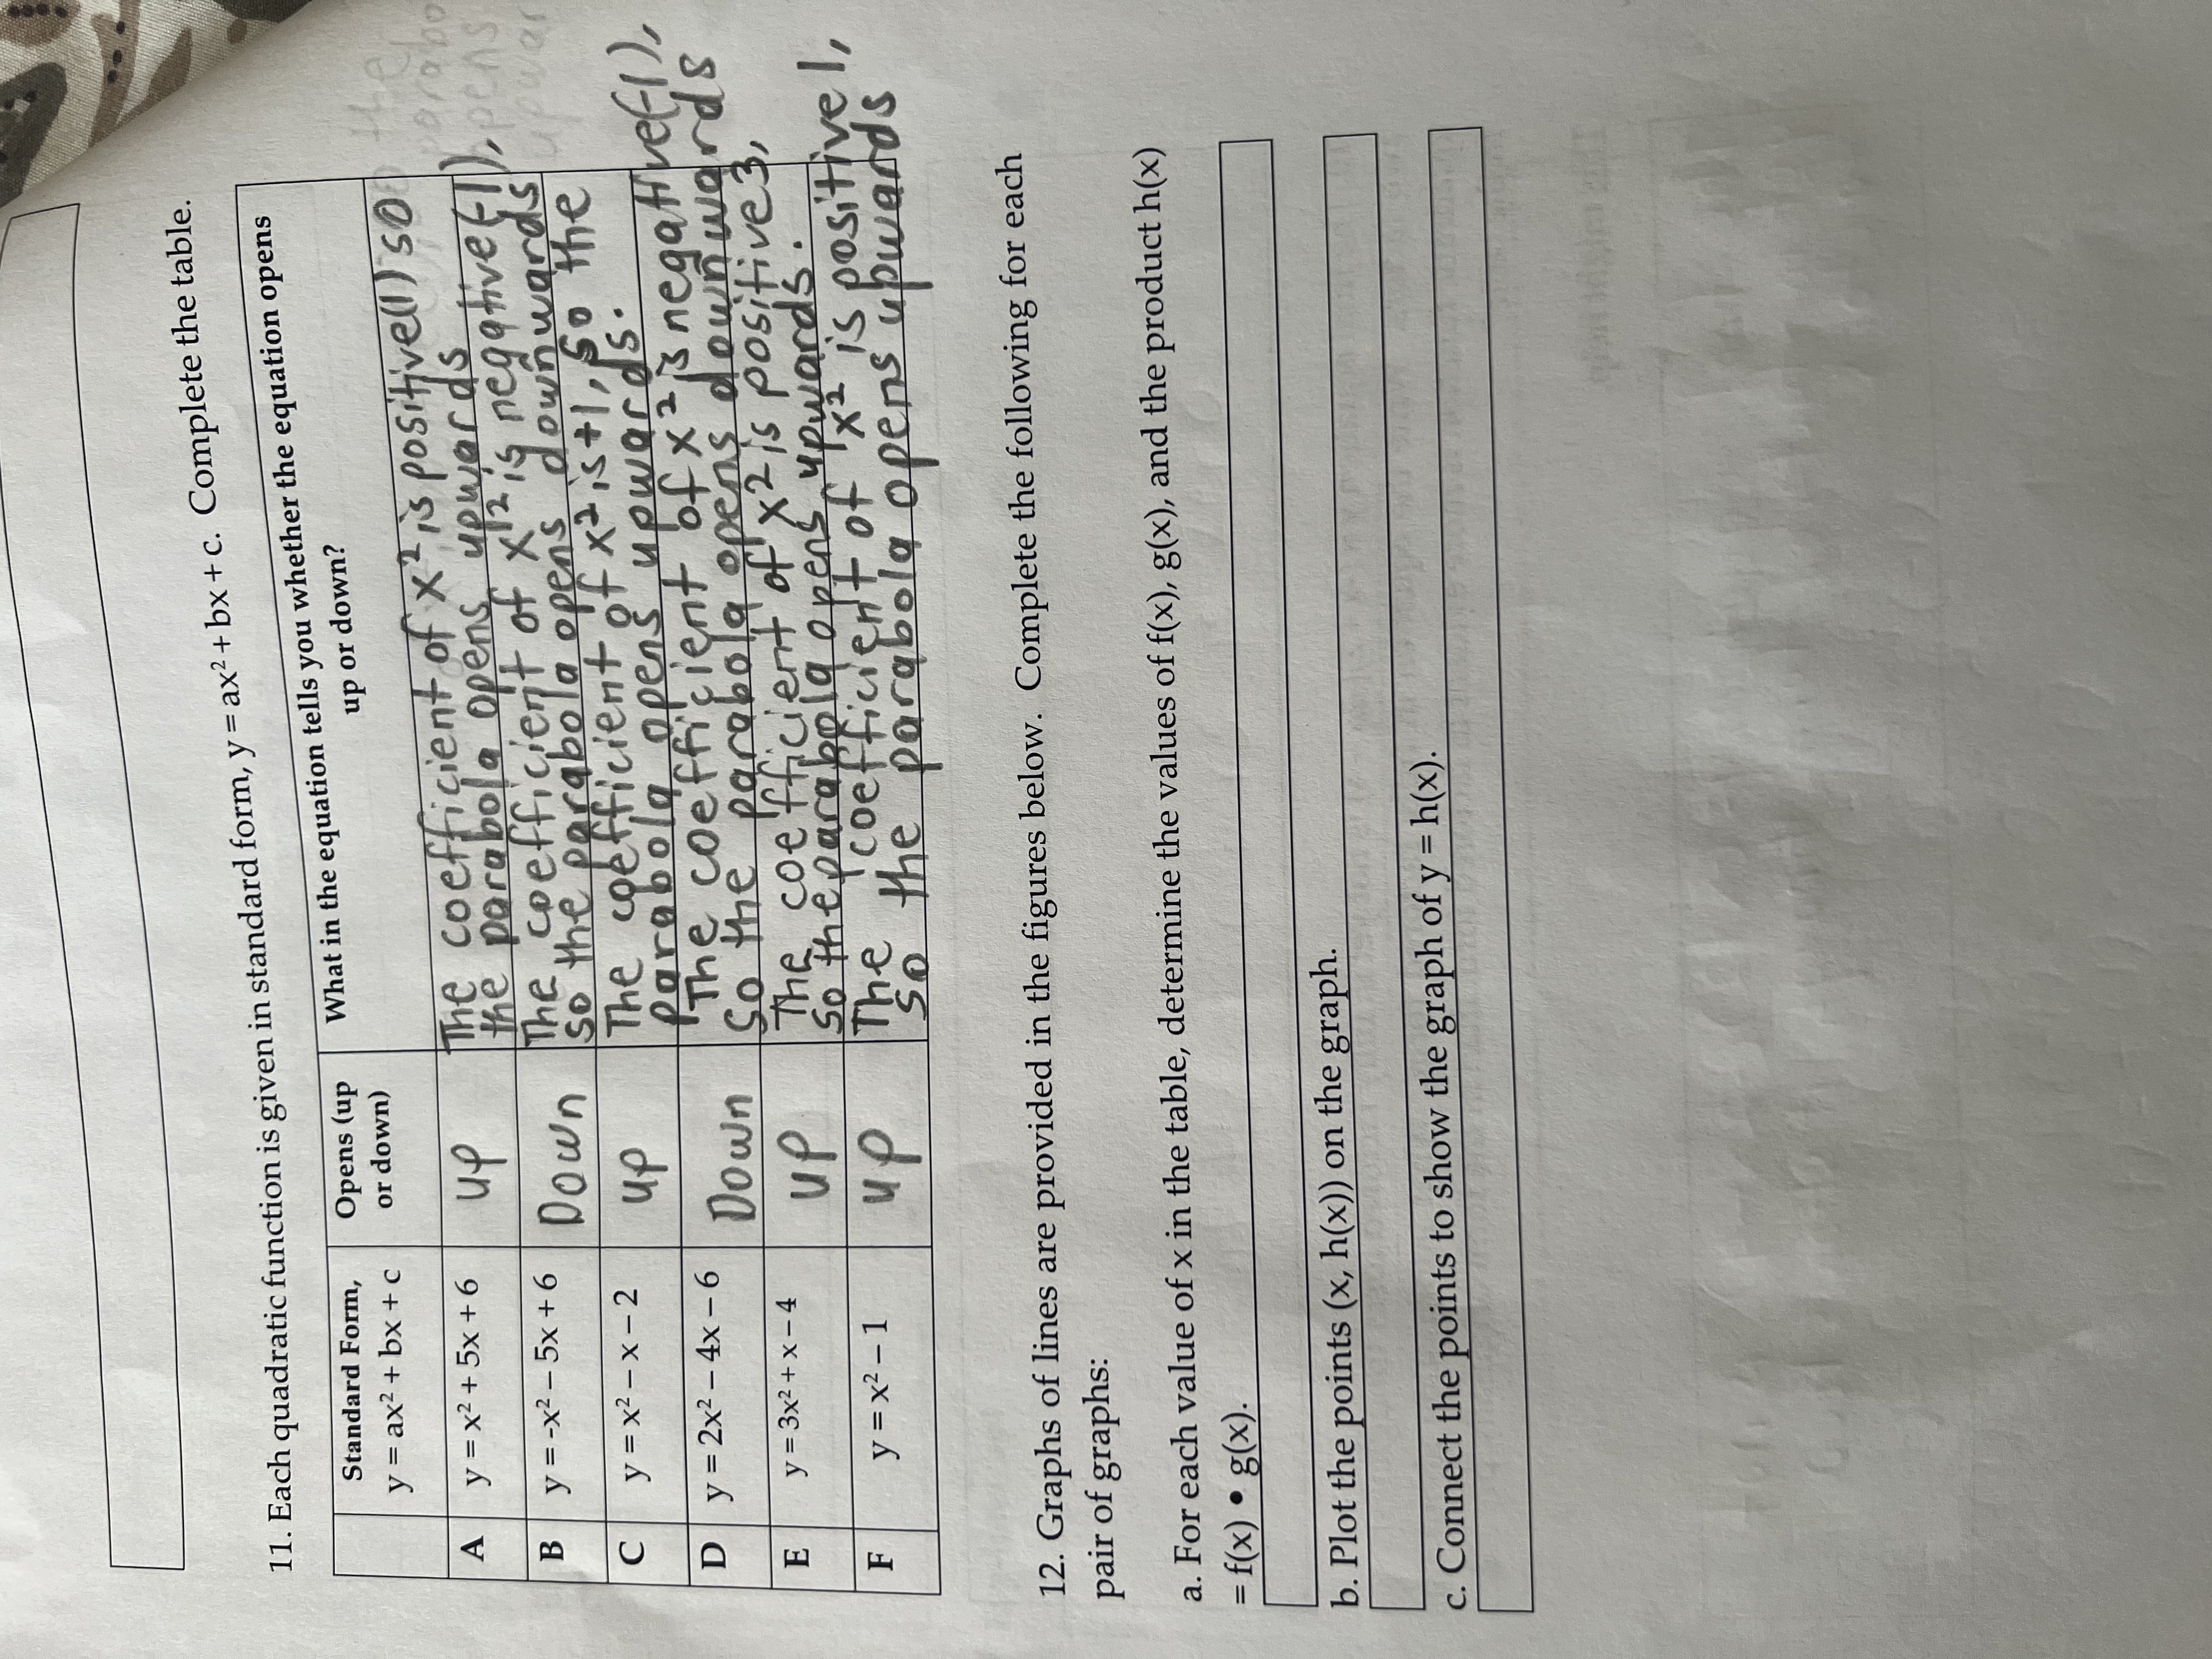
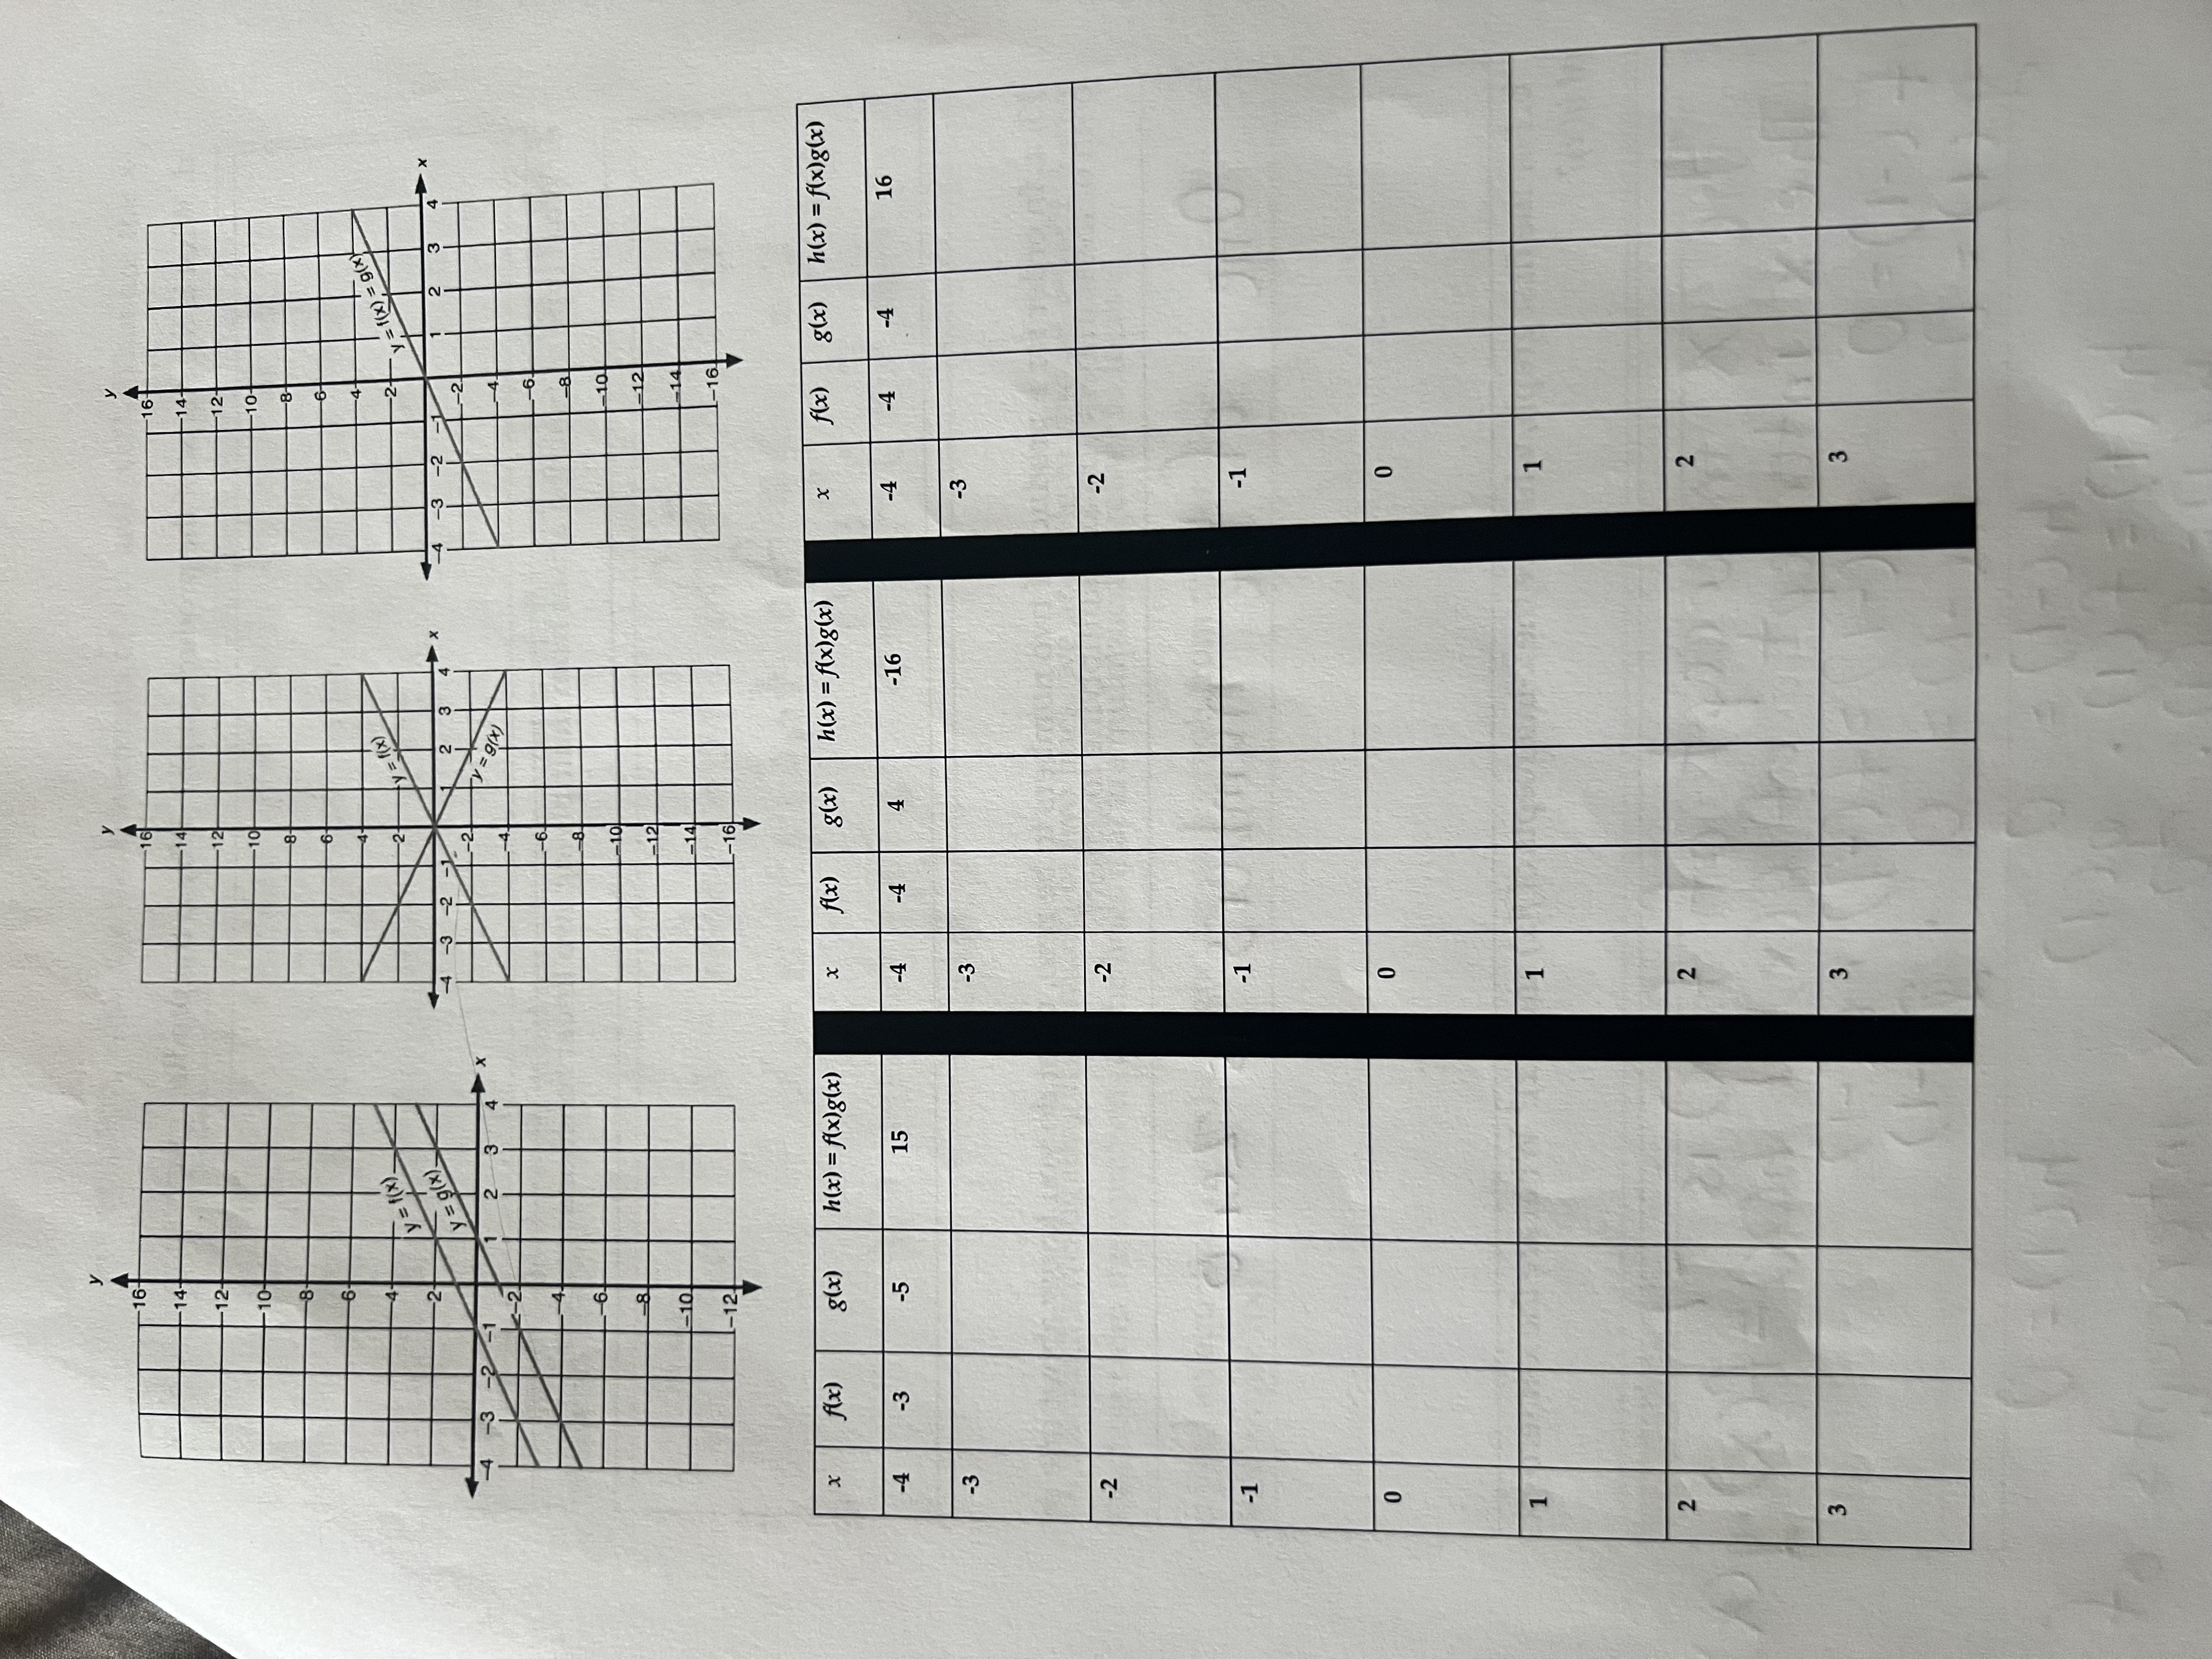
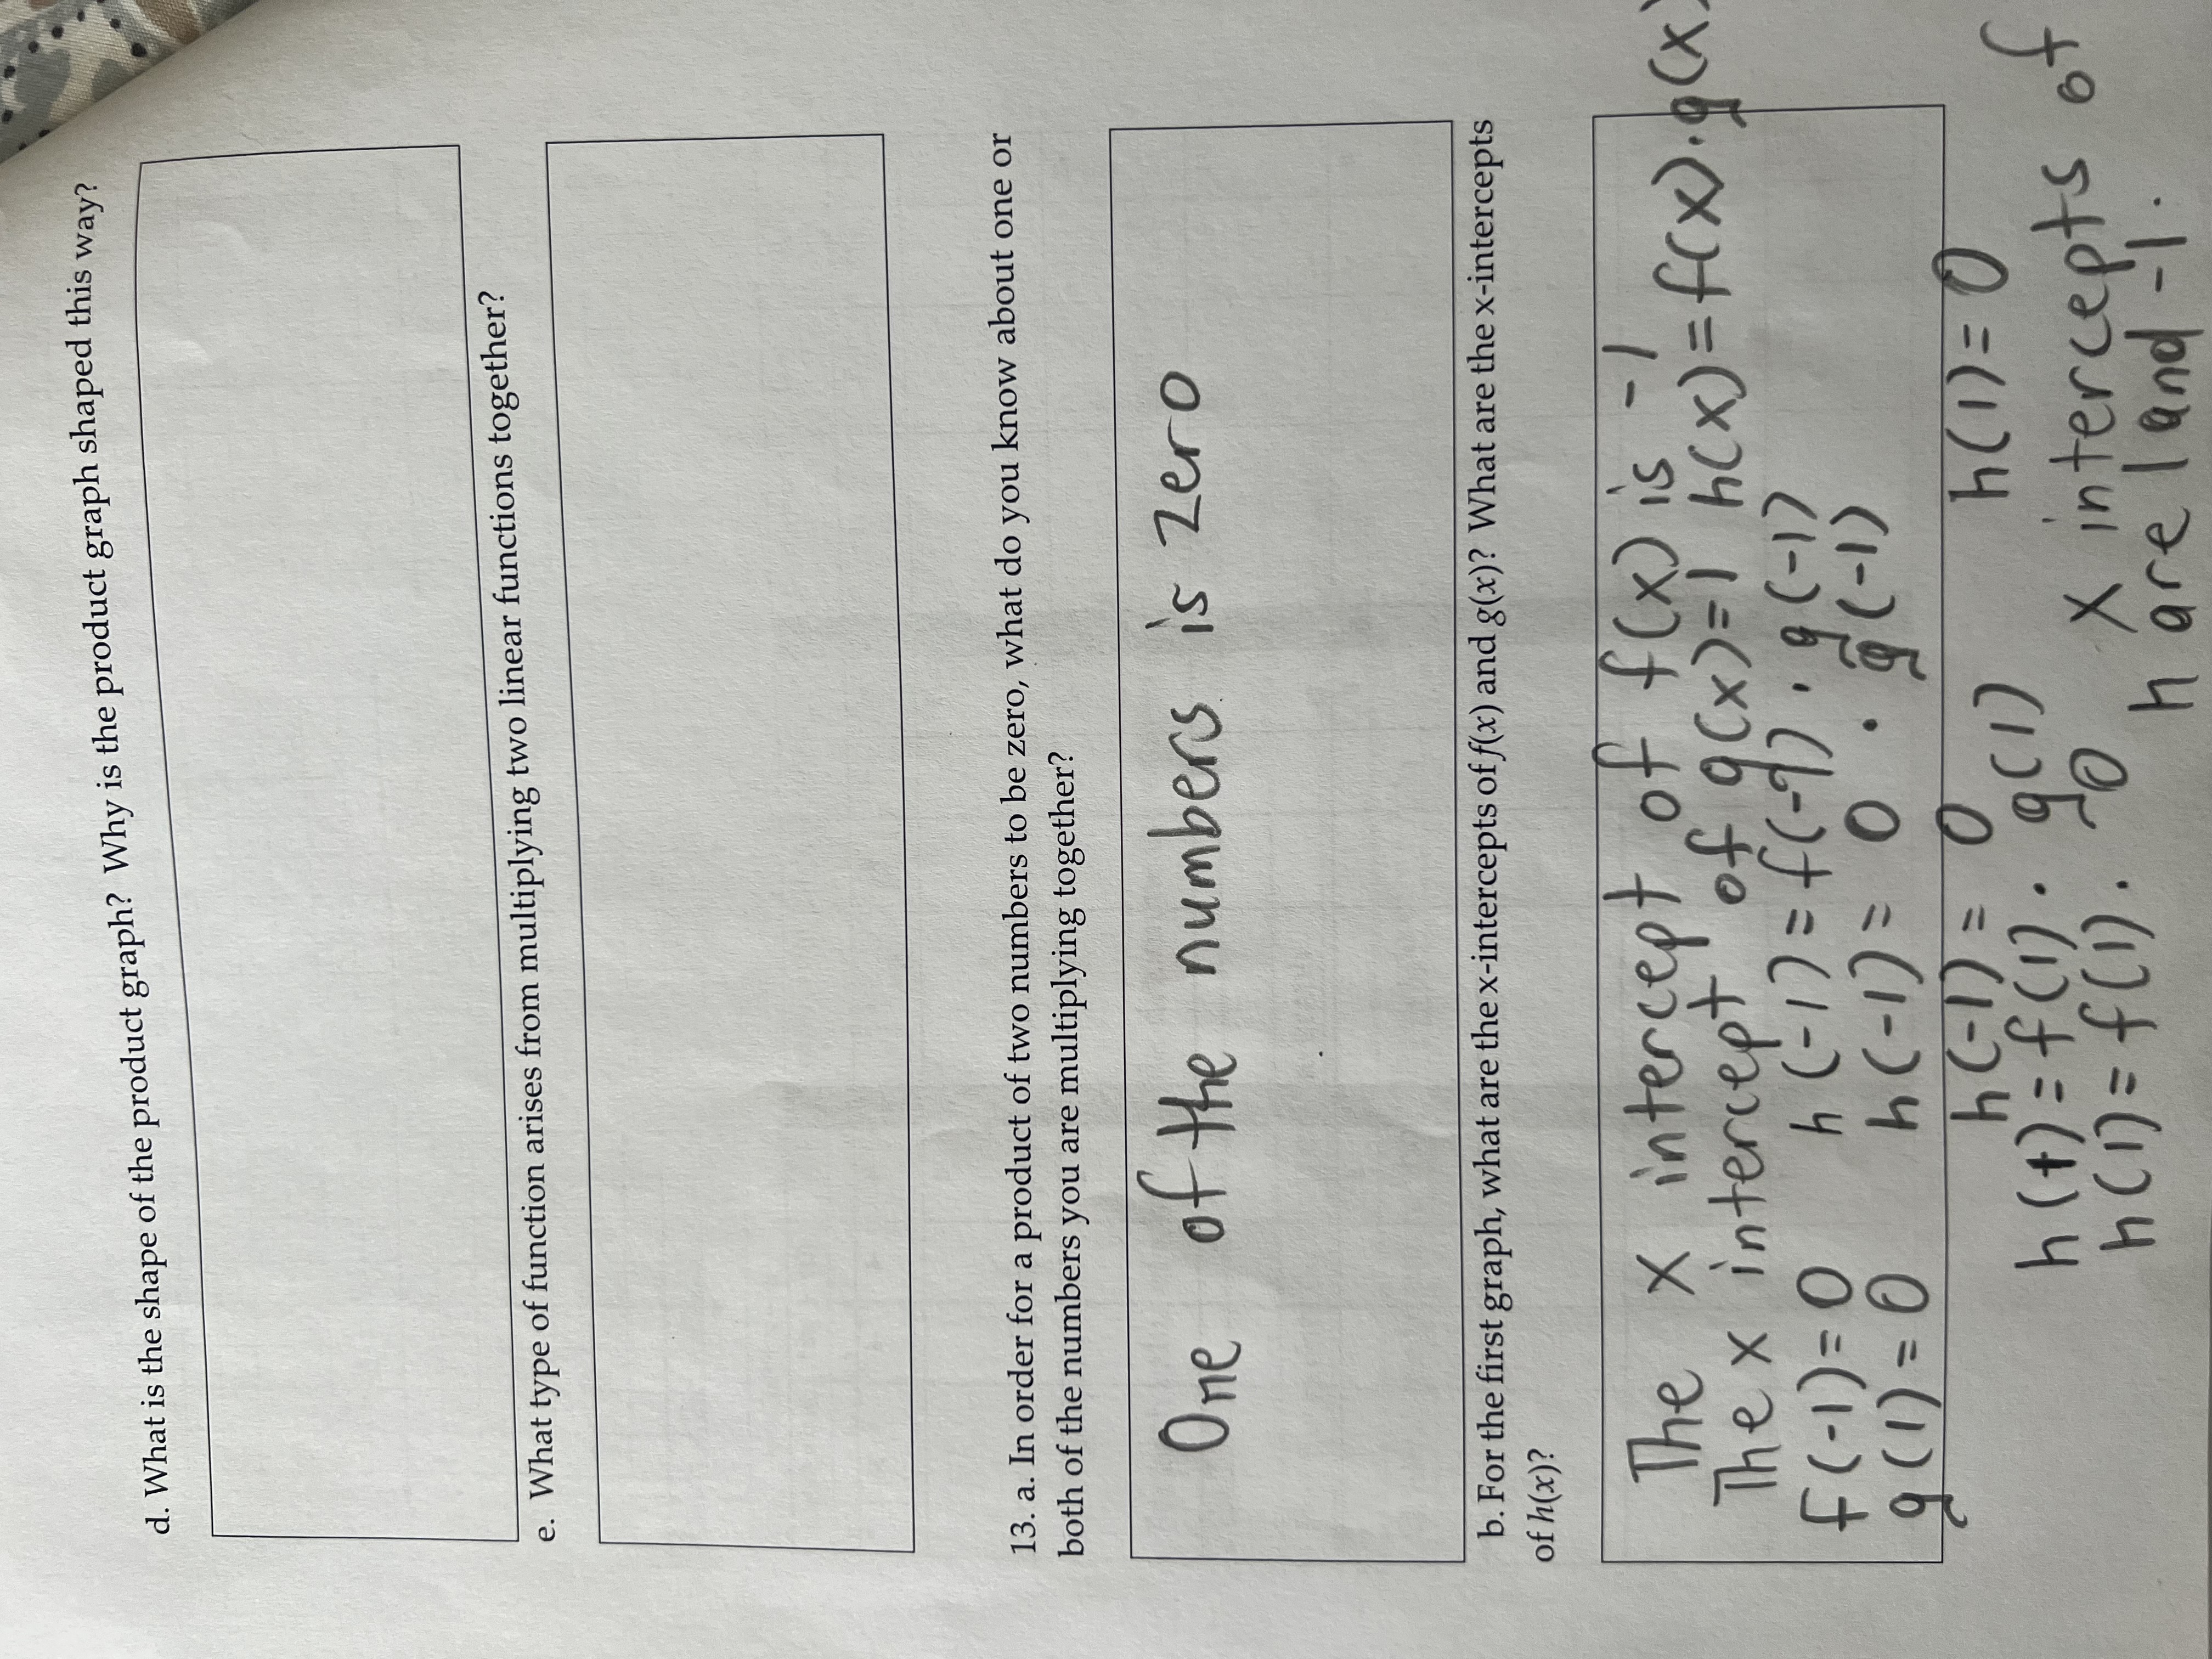
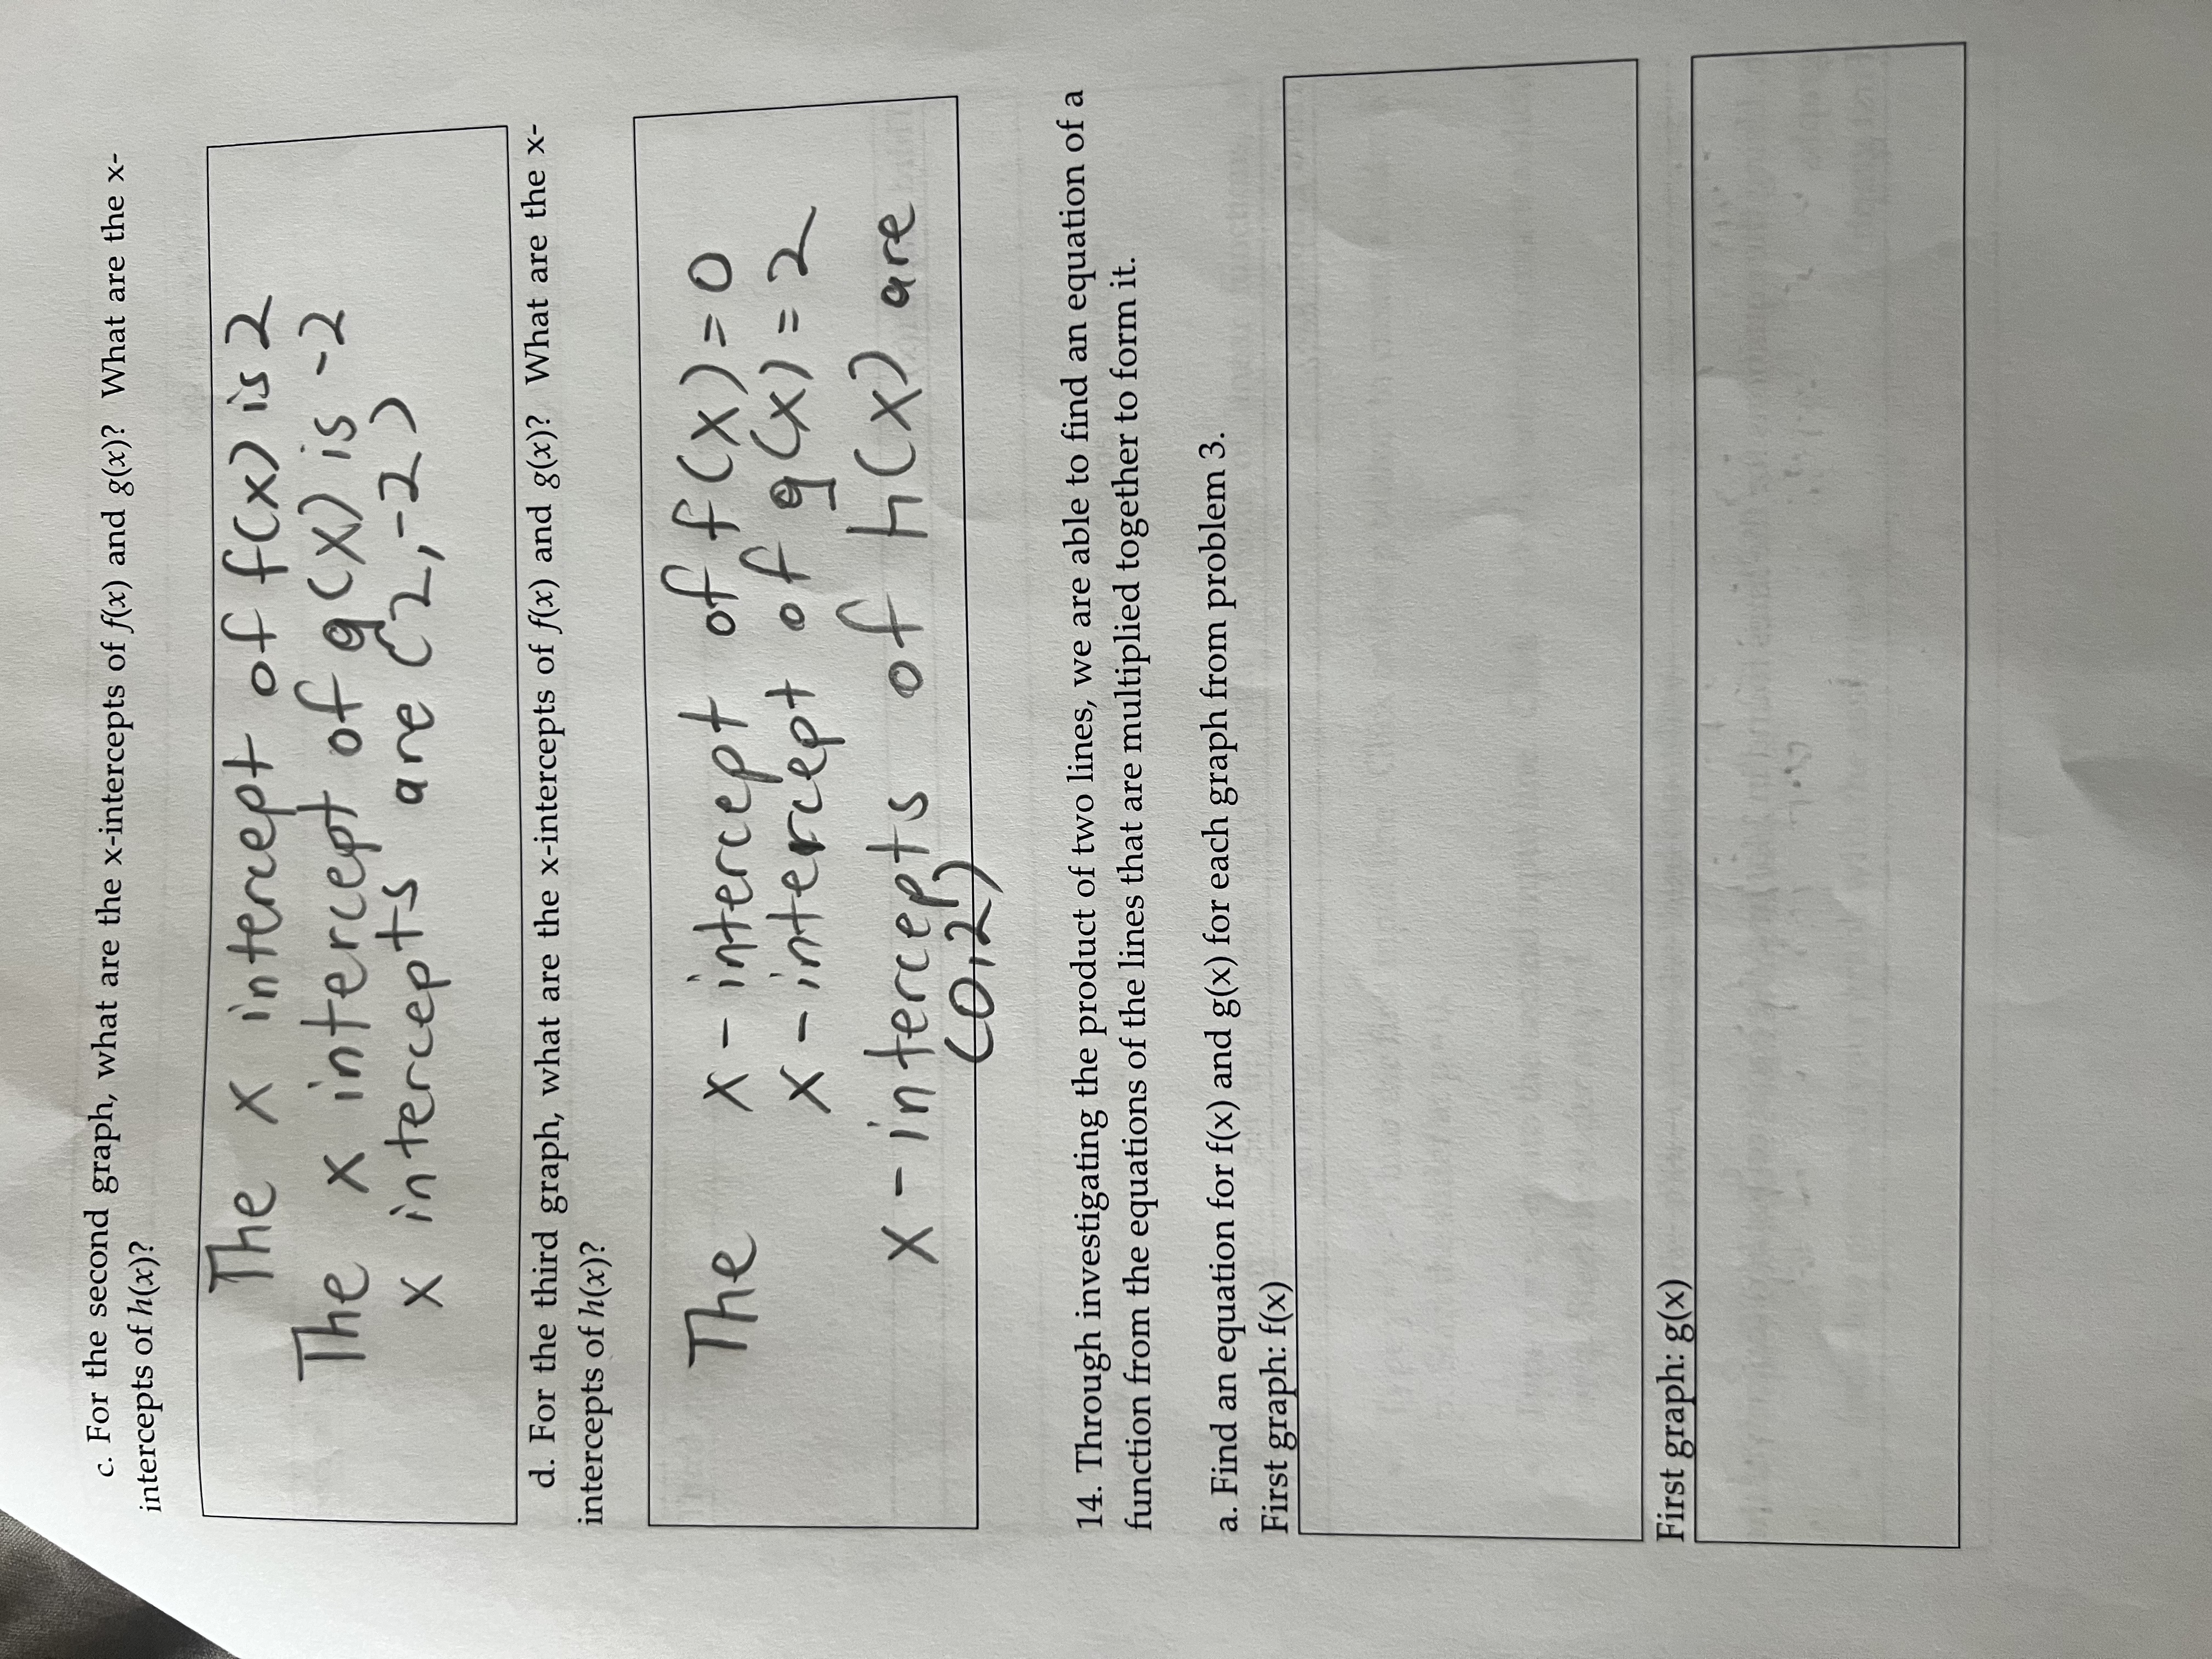
11. Each quadratic function is given in standard form, y = ax2 + bx + c. Complete the table. What in the equation tells you whether the equation opens Standard Form, Opens (up up or down? y = ax2 + bx + c or down) The coefficient of X "is positivell) so the A y = x2 + 5x +6 up the parabola opens upwards arabo B y = -x2 - 5x +6 pens Down The coefficient of x 2 is negative ( ), so the parabola opens downwards C y = x2 - x -2 up The coefficient of x2 is+ 1, so the parabola opens upwards. D y = 2x2 - 4x - 6 Down The coefficient of x 2 is negativefl ), So the parabola opens downwards E y = 3x2 + x - 4 up The coefficient of x2 is positive3, So the parabola opens upwards . F y = x2 - 1 up The coeffi fficient of x2 is positive !, So the parabola opens upwards 12. Graphs of lines are provided in the figures below. Complete the following for each pair of graphs: a. For each value of x in the table, determine the values of f(x), g(x), and the product h(x) =f(x) . g(x). b. Plot the points (x, h(x)) on the graph. c. Connect the points to show the graph of y = h(x).V = 1(X) y = 9(X) = 1( X) = 9(x 3 -10 N 16 f(x) g (x) h(x) = A(x)g(x) x f(x) g(x) -4 -3 h(x) = f(x)g(x) -5 x 15 f(x) -4 g ( x) h(x) = f(x)g(x) -4 -3 -16 -4 -4 16 -3 -2 -2 -2 -1 -1 -1 0 2 2d. What is the shape of the product graph? Why is the product graph shaped this way? e. What type of function arises from multiplying two linear functions together? 13. a. In order for a product of two numbers to be zero, what do you know about one or both of the numbers you are multiplying together? One of the numbers is zero b. For the first graph, what are the x-intercepts of f(x) and g(x)? What are the x-intercepts of h(x) ? The x intercept of f( x) is - 1 The x intercept of q (x ) = 1 h(x )= f(x).(x F ( - 1 ) = 0 h ( - 17 = f ( - 9) . 9( - 17 9 ( 1 ) = 0 h ( - 1 ) = 0 . 9 ( - 1 ) h ( - 1 ) = 0 h (t ) = f( 1). q(1) h ( 1 ) = 0 h ( 1) = f (i). 0, X intercepts of hare land - 1 .c. For the second graph, what are the x-intercepts of f(x) and g(x)? What are the x- intercepts of h(x)? The X intercept of f(x ) is 2 The x intercept of g(x ) is - 2 x intercepts are (2, - 2 ) d. For the third graph, what are the x-intercepts of f(x) and g(x)? What are the x- intercepts of h(x)? The x - intercept of f ( x ) = 0 x - intercept of 9 ( x ) = 2 X - intercepts of hi(x) are (012) 14. Through investigating the product of two lines, we are able to find an equation of a function from the equations of the lines that are multiplied together to form it. a. Find an equation for f(x) and g(x) for each graph from problem 3. First graph: f(x) First graph: g(x)Second graph: f(x) Second graph: g(x) Third graph: f(x) Third graph: g(x) b. Using the equations for the lines found in 14a, find the equation for h(x) for each of the graphs. First graphSecond graph Third graph Check out these videos. The link should take you to a list of videos in youtube. 15. Go to Desmos. Set up Desmos to play with products of linear functions, as follows. This video can help. . Type y = x - p into the first input line. Click on the p button to create a slider for p. Start the slider at p = 0. . Type y = x - q into the second input line. Click on the q button to create a slider for q. Start the slider at q = 1. . Type y = (x - p)(x - q) into the third input line. . Type y = x2 into the fourth input line. . Include a picture of your graph with the assignment.a. Play with the p slider. Pay particular attention to the x-intercept. How does the graph of the product of two lines change as you change p? How does it change in relation to y = x2? b. Play with the q slider. Pay particular attention to the x-intercept. How does the graph of the product of two lines change as you change q? How does it change in relation to y = x2? c. Edit the first input line to be y = a(x - p). Create a slider for a. Edit the third input line to be y = a(x - p)(x - q). Include a picture of your desmos graph when you turn in your assignment. Play with the a slider. For what values of a does the parabola appear to be wider than y = x2? For what values of a does the parabola appear to be steeper than y = x2? d. What happens when a is negative? What happens when a is positive
Step by Step Solution
There are 3 Steps involved in it

Get step-by-step solutions from verified subject matter experts