

Question: 1.1 Explain what this normal quantile plot tells us about the distribution of the ant head lengths. 1.2 What is the shape of the sampling
1.1 Explain what this normal quantile plot tells us about the distribution of the ant head lengths.
1.2 What is the shape of the sampling distribution of x?
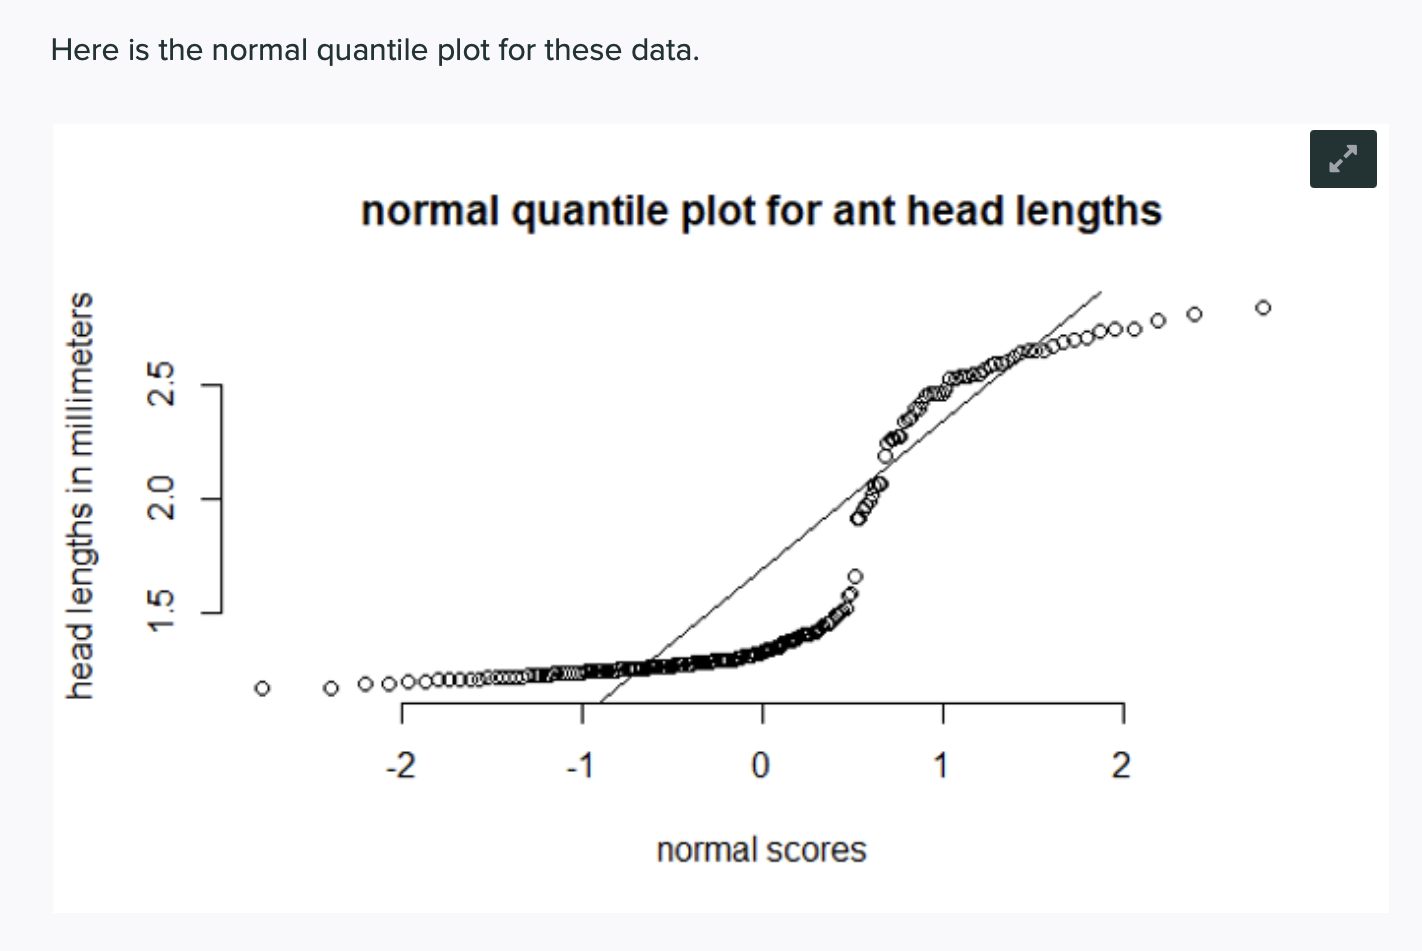
Here is the normal quantile plot for these data. normal quantile plot for ant head lengths o head lengths in millimeters 1.5 2.0 2.5 O -2 -1 O 2 normal scores
Step by Step Solution
There are 3 Steps involved in it
1 Expert Approved Answer
Step: 1 Unlock

Question Has Been Solved by an Expert!
Get step-by-step solutions from verified subject matter experts
Step: 2 Unlock
Step: 3 Unlock