

Question: 11. Format the 3-D pie chart as follows to make it easier to interpret: a. Use Total Sales as the chart title. b. Add data
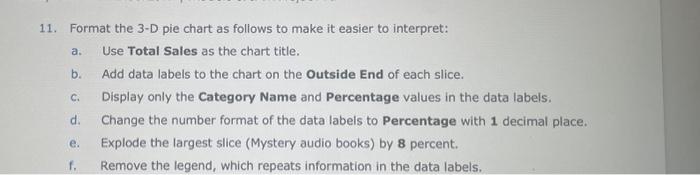
11. Format the 3-D pie chart as follows to make it easier to interpret: a. Use Total Sales as the chart title. b. Add data labels to the chart on the Outside End of each slice. c. Display only the Category Name and Percentage values in the data labels. d. Change the number format of the data labels to Percentage with 1 decimal place. e. Explode the largest slice (Mystery audio books) by 8 percent. f. Remove the legend, which repeats information in the data labels. 11. Format the 3-D pie chart as follows to make it easier to interpret: a. Use Total Sales as the chart title. b. Add data labels to the chart on the Outside End of each slice. c. Display only the Category Name and Percentage values in the data labels. d. Change the number format of the data labels to Percentage with 1 decimal place. e. Explode the largest slice (Mystery audio books) by 8 percent. f. Remove the legend, which repeats information in the data labels
Step by Step Solution
There are 3 Steps involved in it

Get step-by-step solutions from verified subject matter experts