

Question: Outcomes and Objectives For this assignment, you are to use Excel applications and present visual information about the top six most visited national parks. The
Outcomes and Objectives
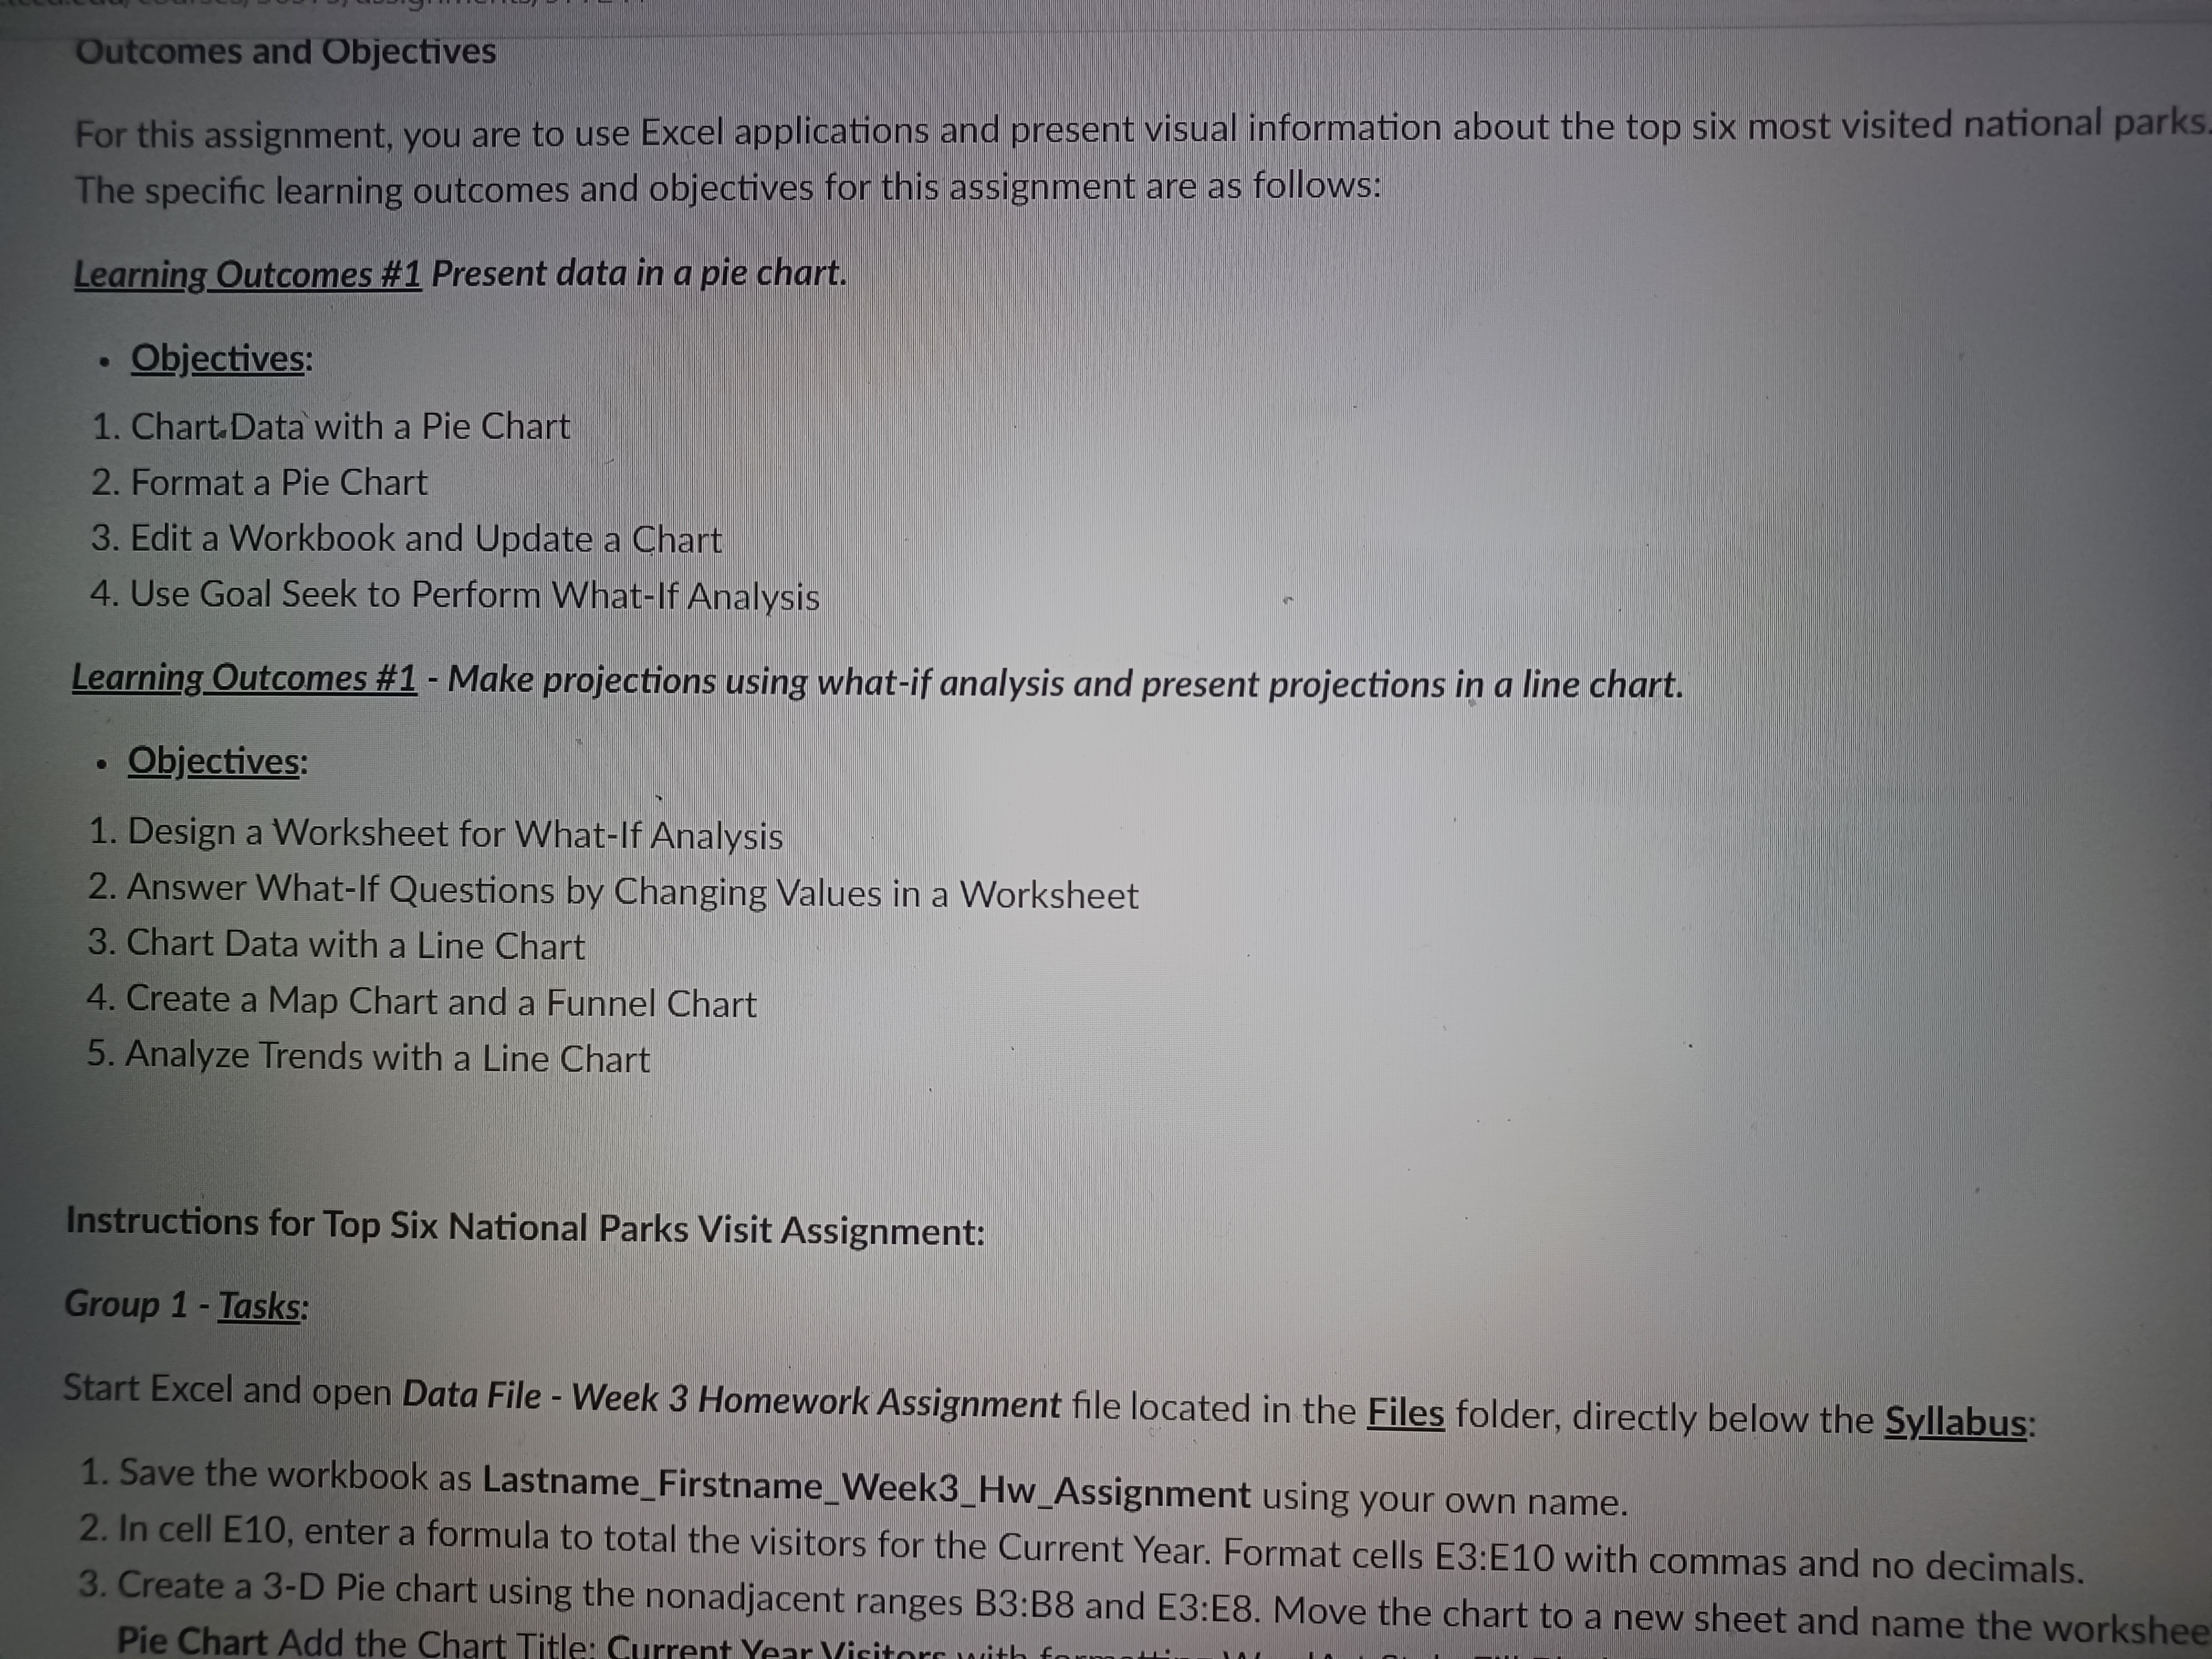
For this assignment, you are to use Excel applications and present visual information about the top six most visited national parks. The specific learning outcomes and objectives for this assignment are as follows:
Learning Outcomes #1 Present data in a pie chart.
- Objectives:
- Chart Data with a Pie Chart
- Format a Pie Chart
- Edit a Workbook and Update a Chart
- Use Goal Seek to Perform What-If Analysis
Learning Outcomes #1 - Make projections using what-if analysis and present projections in a line chart.
- Objectives:
- Design a Worksheet for What-If Analysis
- Answer What-If Questions by Changing Values in a Worksheet
- Chart Data with a Line Chart
- Make a Map Chart and a Funnel Chart
- Analyze Trends with a Line Chart
Instructions for Top Six National Parks Visit Assignment:
Group 1 - Tasks:
Start Excel and open Data File - Week 3 Homework Assignment file located in the Files folder, directly below the Syllabus:
- Save the workbook as Lastname_Firstname_Week3_Hw_Assignment using your own name.
- In cell E10, enter a formula to total the visitors for the Current Year. Format cells E3:E10 with commas and no decimals.
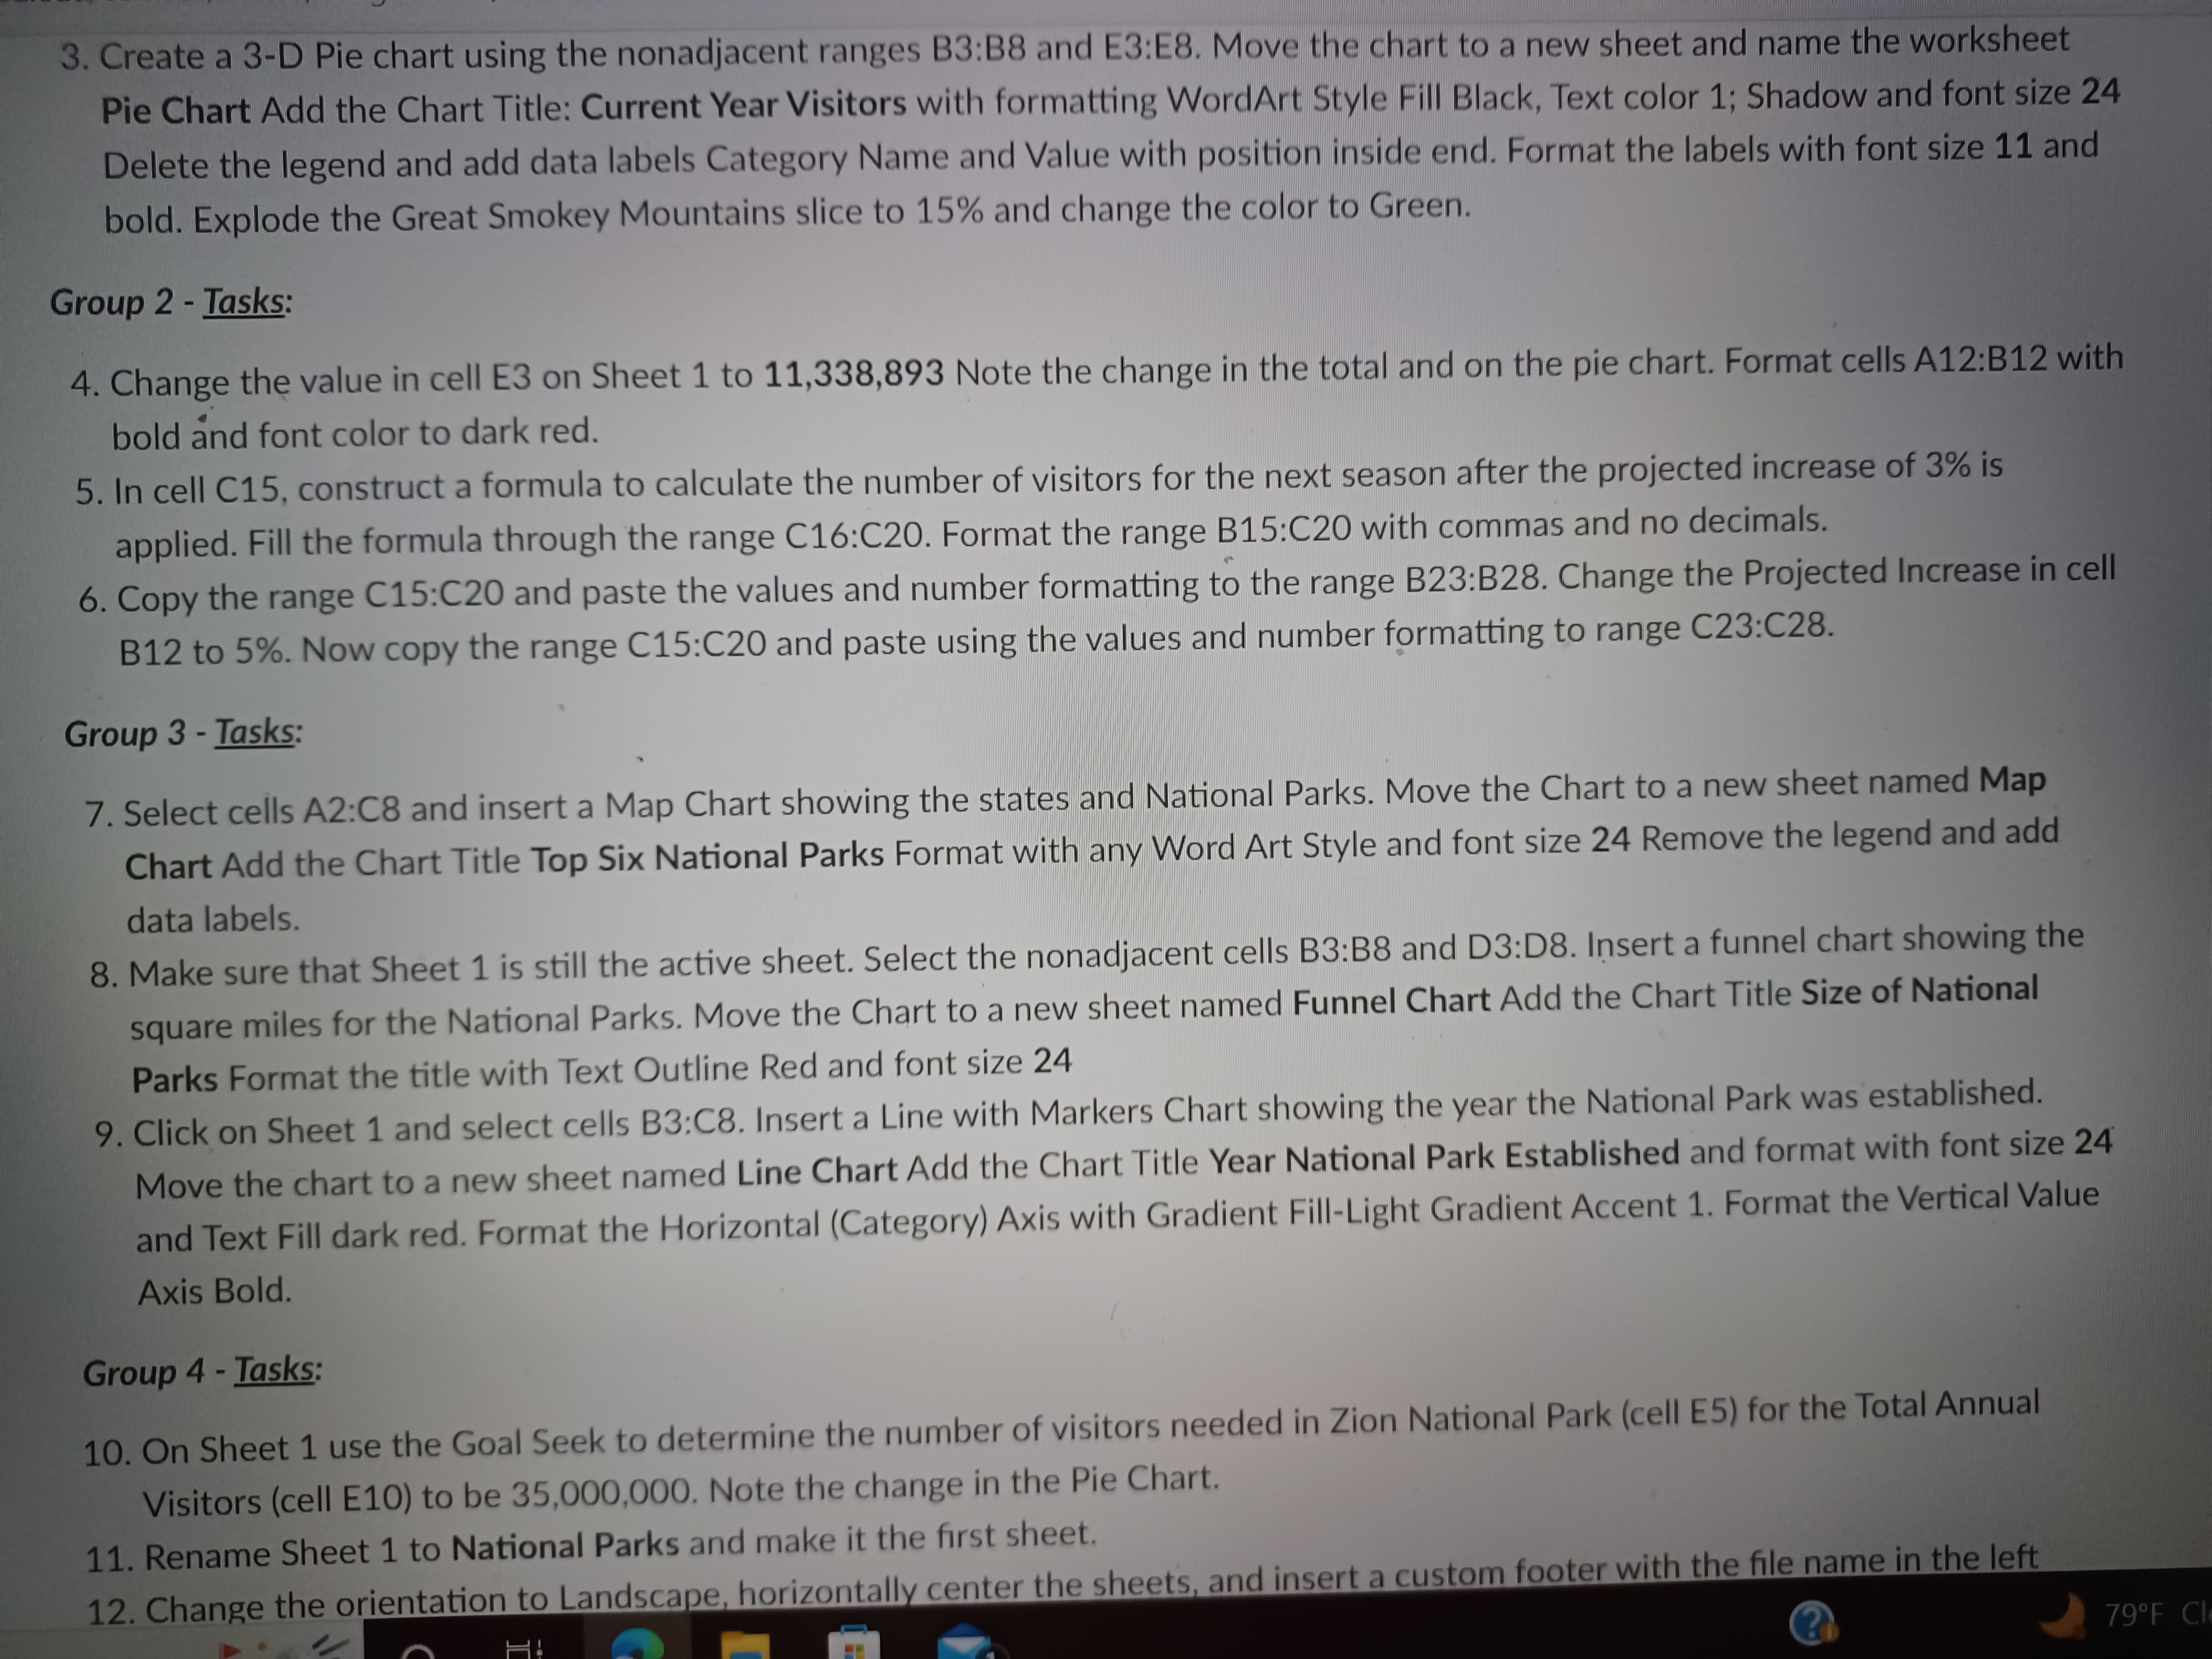
- Make a 3-D Pie chart using the nonadjacent ranges B3:B8 and E3:E8. Move the chart to a new sheet and name the worksheet Pie Chart Add the Chart Title: Current Year Visitors with formatting WordArt Style Fill Black, Text color 1; Shadow and font size 24 Delete the legend and add data labels Category Name and Value with position inside end. Format the labels with font size 11 and bold. Explode the Great Smokey Mountains slice to 15% and change the color to Green.
Group 2 - Tasks:
- Change the value in cell E3 on Sheet 1 to 11,338,893 Note the change in the total and on the pie chart. Format cells A12:B12 with bold and font color to dark red.
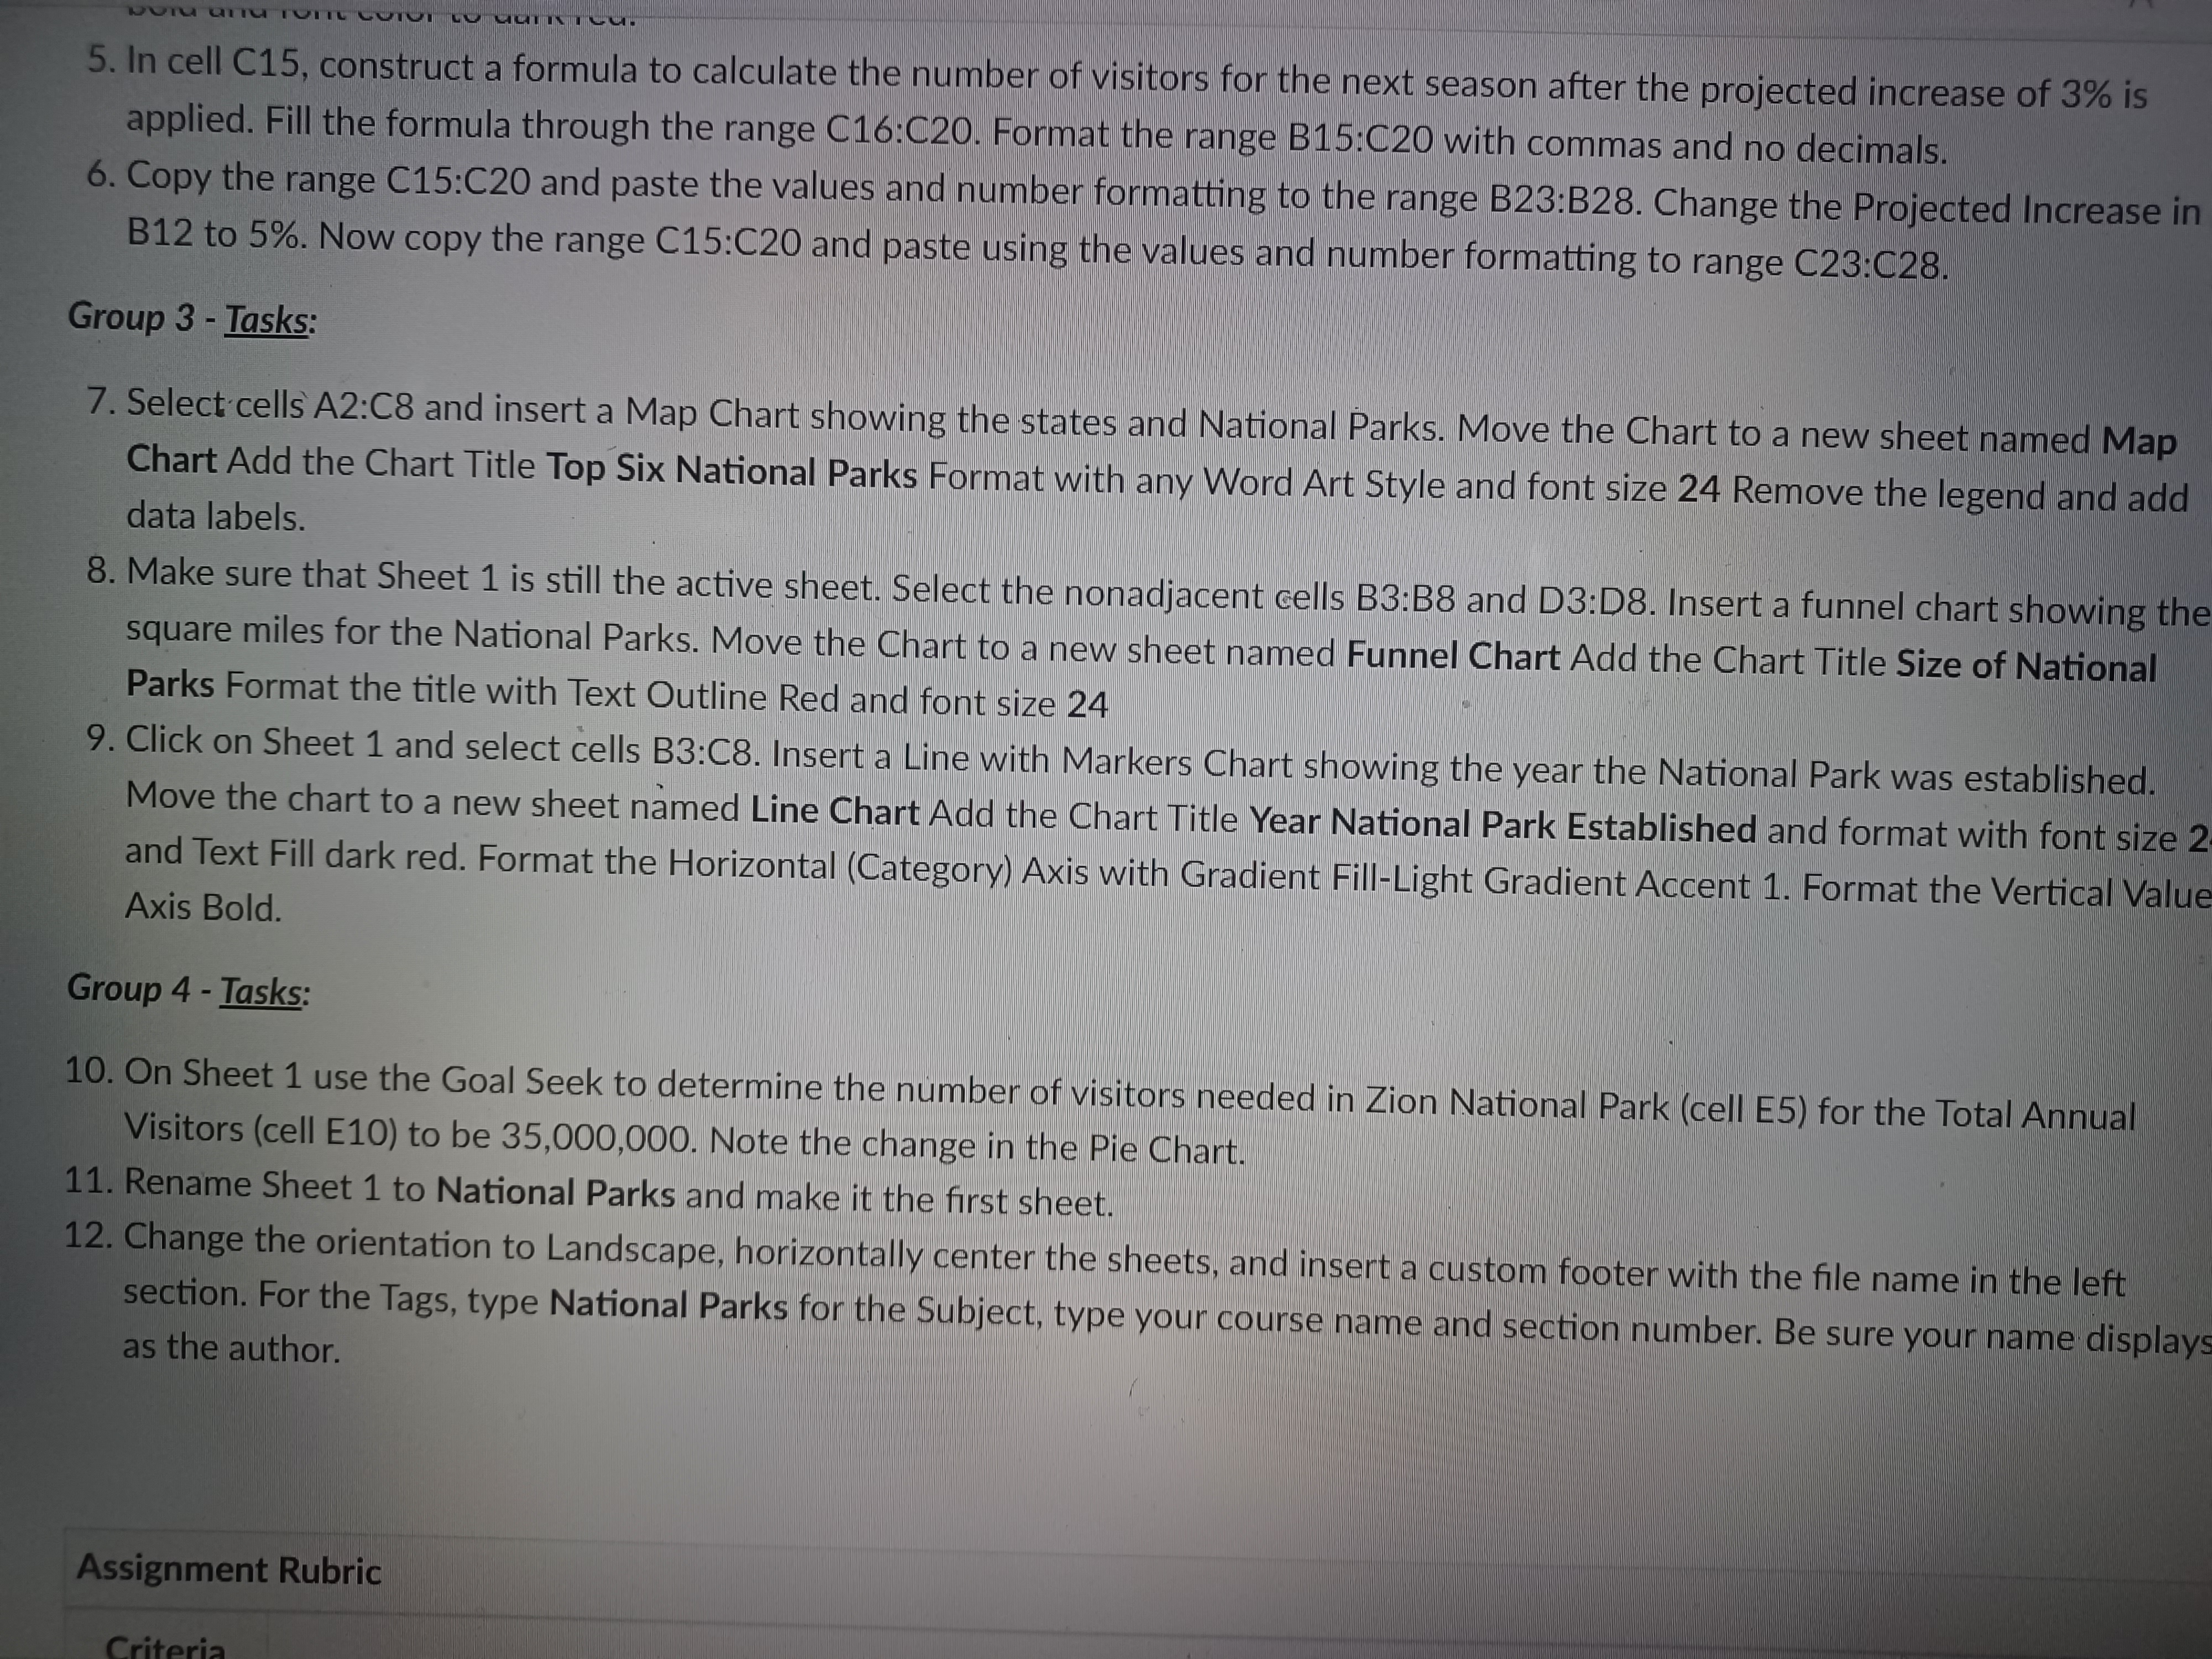
- In cell C15, construct a formula to calculate the number of visitors for the next season after the projected increase of 3% is applied. Fill the formula through the range C16:C20. Format the range B15:C20 with commas and no decimals.
- Copy the range C15:C20 and paste the values and number formatting to the range B23:B28. Change the Projected Increase in cell B12 to 5%. Now copy the range C15:C20 and paste using the values and number formatting to range C23:C28.
Group 3 - Tasks:
- Select cells A2:C8 and insert a Map Chart showing the states and National Parks. Move the Chart to a new sheet named Map Chart Add the Chart Title Top Six National Parks Format with any Word Art Style and font size 24 Remove the legend and add data labels.
- Make sure that Sheet 1 is still the active sheet. Select the nonadjacent cells B3:B8 and D3:D8. Insert a funnel chart showing the square miles for the National Parks. Move the Chart to a new sheet named Funnel Chart Add the Chart Title Size of National Parks Format the title with Text Outline Red and font size 24
- Click on Sheet 1 and select cells B3:C8. Insert a Line with Markers Chart showing the year the National Park was established. Move the chart to a new sheet named Line Chart Add the Chart Title Year National Park Established and format with font size 24 and Text Fill dark red. Format the Horizontal (Category) Axis with Gradient Fill-Light Gradient Accent 1. Format the Vertical Value Axis Bold.
Group 4 - Tasks:
- On Sheet 1 use the Goal Seek to determine the number of visitors needed in Zion National Park (cell E5) for the Total Annual Visitors (cell E10) to be 35,000,000. Note the change in the Pie Chart.
- Rename Sheet 1 to National Parks and make it the first sheet.
- Change the orientation to Landscape, horizontally center the sheets, and insert a custom footer with the file name in the left section. For the Tags, type National Parks for the Subject, enter the course name and section number. Be sure your name displays as the author.
Outcomes and Objectives For this assignment, you are to use Excel applications and present visual information about the top six most visited national parks The specific learning outcomes and objectives for this assignment are as follows: Learning Outcomes #1 Present data in a pie chart. . Objectives: 1. Chart. Data with a Pie Chart 2. Format a Pie Chart 3. Edit a Workbook and Update a Chart 4. Use Goal Seek to Perform What-If Analysis Learning Outcomes #1 - Make projections using what-if analysis and present projections in a line chart. . Objectives: 1. Design a Worksheet for What-If Analysis 2. Answer What-If Questions by Changing Values in a Worksheet 3. Chart Data with a Line Chart 4. Create a Map Chart and a Funnel Chart 5. Analyze Trends with a Line Chart Instructions for Top Six National Parks Visit Assignment: Group 1 - Tasks: Start Excel and open Data File - Week 3 Homework Assignment file located in the Files folder, directly below the Syllabus: 1. Save the workbook as Lastname_Firstname_Week3_Hw_Assignment using your own name. 2. In cell E10, enter a formula to total the visitors for the Current Year. Format cells E3:E10 with commas and no decimals. 3. Create a 3-D Pie chart using the nonadjacent ranges B3:B8 and E3:E8. Move the chart to a new sheet and name the workshee Pie Chart Add the Chart Title. Curre3. Create a 3-D Pie chart using the nonadjacent ranges B3:B8 and E3:E8. Move the chart to a new sheet and name the worksheet Pie Chart Add the Chart Title: Current Year Visitors with formatting WordArt Style Fill Black, Text color 1; Shadow and font size 24 Delete the legend and add data labels Category Name and Value with position inside end. Format the labels with font size 11 and bold. Explode the Great Smokey Mountains slice to 15% and change the color to Green. Group 2 - Tasks: 4. Change the value in cell E3 on Sheet 1 to 11,338,893 Note the change in the total and on the pie chart. Format cells A12:B12 with bold and font color to dark red. 5. In cell C15, construct a formula to calculate the number of visitors for the next season after the projected increase of 3% is applied. Fill the formula through the range C16:C20. Format the range B15:C20 with commas and no decimals. 6. Copy the range C15:C20 and paste the values and number formatting to the range B23:B28. Change the Projected Increase in cell B12 to 5%. Now copy the range C15:C20 and paste using the values and number formatting to range C23:C28. Group 3 - Tasks: 7. Select cells A2:C8 and insert a Map Chart showing the states and National Parks. Move the Chart to a new sheet named Map Chart Add the Chart Title Top Six National Parks Format with any Word Art Style and font size 24 Remove the legend and add data labels. 8. Make sure that Sheet 1 is still the active sheet. Select the nonadjacent cells B3:B8 and D3:D8. Insert a funnel chart showing the square miles for the National Parks. Move the Chart to a new sheet named Funnel Chart Add the Chart Title Size of National Parks Format the title with Text Outline Red and font size 24 9. Click on Sheet 1 and select cells B3:C8. Insert a Line with Markers Chart showing the year the National Park was established. Move the chart to a new sheet named Line Chart Add the Chart Title Year National Park Established and format with font size 24 and Text Fill dark red. Format the Horizontal (Category) Axis with Gradient Fill-Light Gradient Accent 1. Format the Vertical Value Axis Bold. Group 4 - Tasks: 10. On Sheet 1 use the Goal Seek to determine the number of visitors needed in Zion National Park (cell E5) for the Total Annual Visitors (cell E10) to be 35,000,000. Note the change in the Pie Chart. 11. Rename Sheet 1 to National Parks and make it the first sheet. 12. Change the orientation to Landscape, horizontally center the sheets, and insert a custom footer with the file name in the left 790F C5. In cell C15, construct a formula to calculate the number of visitors for the next season after the projected increase of 3% is applied. Fill the formula through the range C16:C20. Format the range B15:C20 with commas and no decimals. 6. Copy the range C15:C20 and paste the values and number formatting to the range B23:B28. Change the Projected Increase in B12 to 5%. Now copy the range C15:C20 and paste using the values and number formatting to range C23:C28. Group 3 - Tasks: 7. Select cells A2:C8 and insert a Map Chart showing the states and National Parks. Move the Chart to a new sheet named Map Chart Add the Chart Title Top Six National Parks Format with any Word Art Style and font size 24 Remove the legend and add data labels. 8. Make sure that Sheet 1 is still the active sheet. Select the nonadjacent cells B3:B8 and D3:D8. Insert a funnel chart showing the square miles for the National Parks. Move the Chart to a new sheet named Funnel Chart Add the Chart Title Size of National Parks Format the title with Text Outline Red and font size 24 9. Click on Sheet 1 and select cells B3:C8. Insert a Line with Markers Chart showing the year the National Park was established Move the chart to a new sheet named Line Chart Add the Chart Title Year National Park Established and format with font size 2 and Text Fill dark red. Format the Horizontal (Category) Axis with Gradient Fill-Light Gradient Accent 1. Format the Vertical Value Axis Bold. Group 4 - Tasks: 10. On Sheet 1 use the Goal Seek to determine the number of visitors needed in Zion National Park (cell E5) for the Total Annual Visitors (cell E10) to be 35,000,000. Note the change in the Pie Chart. 11. Rename Sheet 1 to National Parks and make it the first sheet. 12. Change the orientation to Landscape, horizontally center the sheets, and insert a custom footer with the file name in the left section. For the Tags, type National Parks for the Subject, type your course name and section number. Be sure your name displays as the author. Assignment Rubric
Step by Step Solution
There are 3 Steps involved in it

Get step-by-step solutions from verified subject matter experts