Question: 11) If all the products in the Low Tech Segment are equally attractive to the customers, what would the market share of each product be
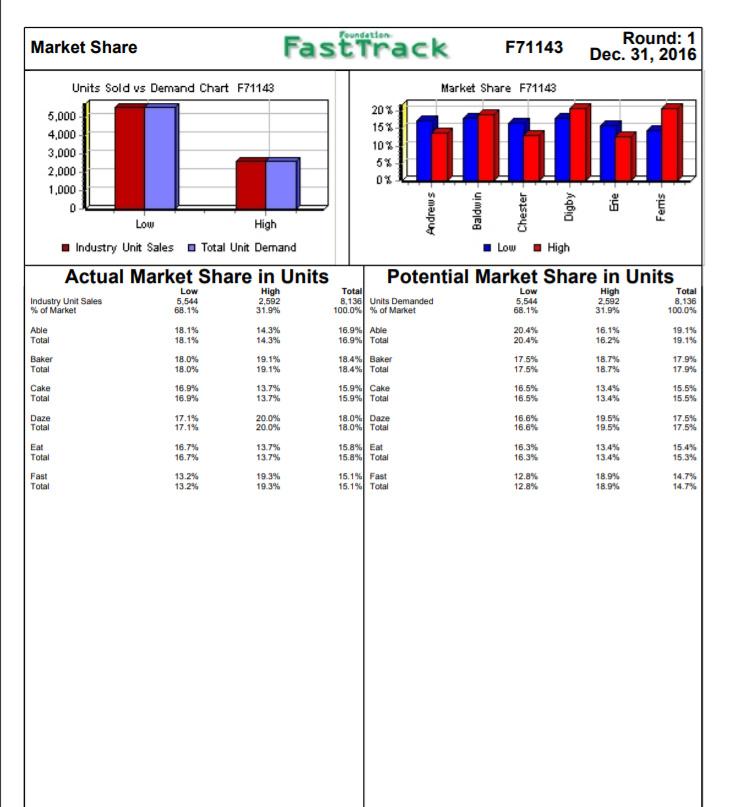
11) If all the products in the Low Tech Segment are equally attractive to the customers, what would the market share of each product be in 2017 (Rd2)? ..5 points
12) Follow the steps from 12a to 12d to calculate a basic sales forecast for product Able in the Low Tech segment in 2017: .10 points
- Set appropriate assumptions for what you expect company Andrews to do with product Ables design and marketing in 2017. Set appropriate assumptions
b. Set appropriate assumptions for what you expect each of Andrews competitors will do with their Low Tech
segment products design and marketing in 2017 (Rd2).
c. Forecast the expected Low Tech market share for Able in 2017 based on (a) and (b).
d. Calculate and show the steps for obtaining your Low Tech basic sales forecast for Able in 2017.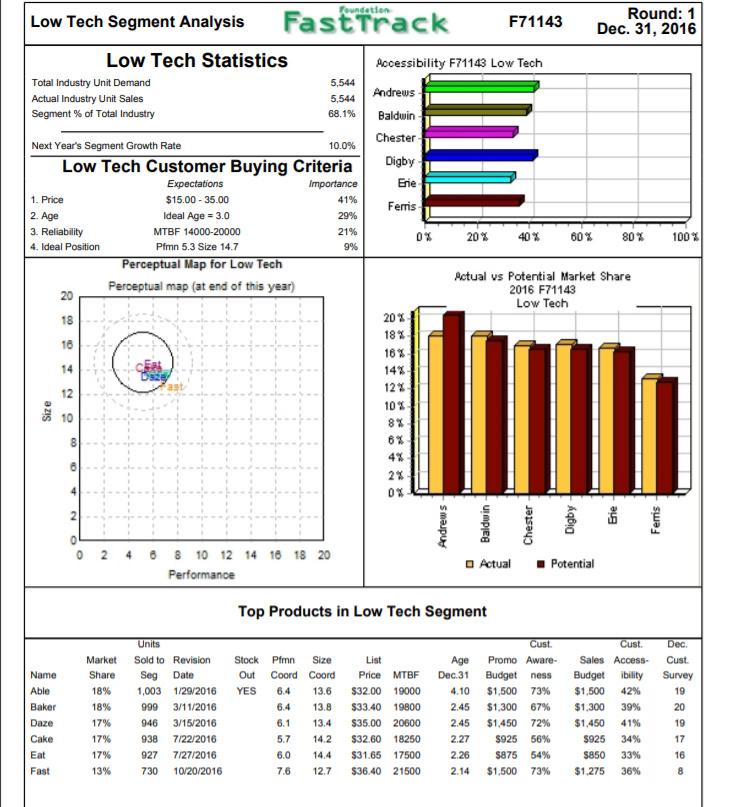
Low Tech Segment Analysis Round: 1 Fast Track F71143 Dec. 31, 2016 Low Tech Statistics Accessibility F71143 Low Tech Total Industry Unit Demand 5,544 Actual Industry Unit Sales Andrews 5,544 Segment % of Total Industry 68.1% Baldwin Chester Next Year's Segment Growth Rate 10.0% Low Tech Customer Buying Criteria Digby Expectations Importance Erie 1. Price $15.00 - 35.00 41% Ferris 2. Age Ideal Age = 3.0 29% 3. Reliability MTBF 14000-20000 21% 0% 20% 40% 60% 80% 100% 4. Ideal Position Pfmn 5.3 Size 14.7 9% Perceptual Map for Low Tech Actual vs Potential Market Share Perceptual map (at end of this year) 20 2016 F71143 Low Tech 18 20% 18% 16 16% 14 14% 12% 12 10% 10 8% 67 4% 2% Size 8 CO 0% 2 Andrews Baldwin 4 6 8 10 12 14 16 18 20 Performance Actual Potential Top Products in Low Tech Segment Stock Out YES Name Able Baker Daze Cake Eat Fast Market Share 18% 18% 17% 17% 17% 13% Units Sold to Revision Seg Date 1,003 1/29/2016 999 3/11/2016 3/15/2016 938 7/22/2016 927 7/27/2016 730 10/20/2016 Pimn Size Coord Coord 6.4 13.6 6.4 13.8 6.1 13.4 5.7 14.2 6.0 14.4 7.6 12.7 List Price MTBF $32.00 19000 $33.40 19800 $35.00 20600 $32.60 18250 $31.65 17500 $36.40 21500 Cust. Promo Aware- Budget ness $1,500 73% $1,300 67% $1.450 72% $925 56% $875 54% $1,500 73% Age Dec.31 4.10 2.45 2.45 2.27 2.26 2.14 946 Cust. Sales Access Budget ibility $1.500 42% $1,300 39% $1.450 41% $925 34% $850 33% $1.275 36% Dec Cust. Survey 19 20 19 17 16 8 Market Share Andrews Low Fast Track Round: 1 F71143 Dec. 31, 2016 Units Sold vs Demand Chart F71143 Market Share F71143 5,000 20% 15% 4,000 10% 3,000 5% 2,000 0% 1,000 D High Industry Unit Sales Total Unit Demand Low High Actual Market Share in Units Potential Market Share in Units Low High Total Low High Total Industry Unit Sales 5.544 2.592 8.136 Units Demanded 5,544 2.592 8.136 % of Market 68.1% 31.9% 100.0% % of Market 68.1% 31.9% 100.0% Able 18.1% 14.3% 16.9% Able 20.4% 16.15 19.1% Total 18.1% 14.3% 16.9% Total 20.4% 16.2% 19.1% Baker 18.0% 19.1% 18.4% Baker 17.5% 18.7% 179% Total 18.0% 19.1% 18.4% Total 17.5% 18.7% 179% Cake 16.9% 13.7% 15.9% Cake 16.5% 13.4% 15.5% Total 16.9% 13.7% 15.9% Total 16.5% 13.4% 15.5% Daze 17.1% 20.0% 18.0% Daze 16.6% 19.5% 17,5% Total 17.1% 20.0% 18.0% Total 16.8% 19.5% 17.5% Eat 16.7% 13.7% 15.8% Eat 16.3% 13.4% 15.4% Total 13.7% 15.8% Total 16.3% 13.4% 15.3% Fast 13.2% 19.3% 15.1% Fast 12.8% 18.9% 14.7% Total 13.2% 19.3% 15.1% Total 12.8% 18.9% 14.7% 16.7% Perceptual Map Round: 1 Dec. 31, 2016 Fast Track F71143 Perceptual Map for All Segments Perceptual map (at end of this year) 20 18 16 14 chat Daze 12 Size 10 8 CO 6 N 0 02 8 10 12 14 16 18 20 Andrews Performance Baldwin Pfmn Size Revised Name 6.4 13.8 3/11/2016 Cake Chester Size Name Able Pfmn 6.4 13.6 Revised Name 1/29/2016 Baker Pfmn 5.7 Size 14.2 Revised 7/22/2016 Digby Erie Ferris Pfmn Pfmn Name Name Daze Size 13.4 Revised Name 3/15/2016 Eat Size 14.4 Revised 7/27/2016 Pfmn 7.6 Size 12.7 Revised 10/20/2016 6.1 6.0 Fast High Tech Segment Analysis Fast Track Round: 1 F71143 Dec. 31, 2016 High Tech Statistics Hocessibility F71143 High Tech Total Industry Unit Demand 2,592 Actual Industry Unit Sales 2,592 Andrews Segment % of Total Industry 31.9% Baldwin Chester Next Year's Segment Growth Rate 20.0% High Tech Customer Buying Criteria Digby Expectations Importance Erie 1. Ideal Position Pfmn 8.1 Size 11.9 33% Ferris 2. Age Ideal Age = 0.0 29% 3. Price $25.00 - 45.00 25% 0% 20% 60% 80% 100% 4. Reliability MTBF 17000-23000 13% Perceptual Map for High Tech Perceptual map (at end of this year) Actual vs Potential Market Share 20 2016 F71143 High Tech 18 20% 18% 16 16% 14 147 12% 12 10% 10 8% 6% 4% 2% 0% Size 8 N 2 Andrews Baldwin Chester Aq 4 6 8 10 12 14 16 18 20 Performance Actual Potential Top Products in High Tech Segment Stock Out Name Daze Fast Baker Able Eat Cake Market Share 20% 19% 19% 14% 14% 14% Units Sold to Revision Seg Date 517 3/15/2016 501 10/20/2016 494 3/11/2016 372 1/29/2016 354 7/27/2016 354 7/22/2016 Pfmn Size Coord Coord 6.1 13.4 7.6 12.7 6.4 13.8 6.4 13.6 6.0 14.4 5.7 14.2 List Price MTBF $35.00 20600 $36.40 21500 $33.40 19800 $32.00 19000 $31.65 17500 $32.60 18250 Age Dec 31 2.45 2.14 2.45 4.10 2.26 2.27 Cust. Promo Aware- Budget ness $1.450 72% $1.500 73% $1.300 67% $1.500 73% $875 54% $925 56% Cust. Sales Access Budget ibility $1.450 42% $1.275 39% $1,300 40% $1.500 43% $850 33% $925 34% Dec. Cust. Survey 12 24 12 11 8 8 YES


