

Question: 11. Look at the two tables below. Identify a 2000-2016 trend in one or more of the health care industries and try to explain the
11. Look at the two tables below. Identify a 2000-2016 trend in one or more of the health care industries and try to explain the trend.
please read and write a long discussion n analysis on the chart given.
please provide the answer asap. thank you.
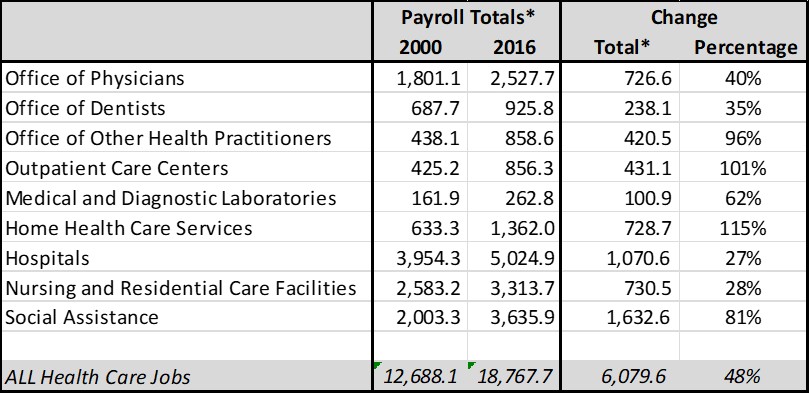
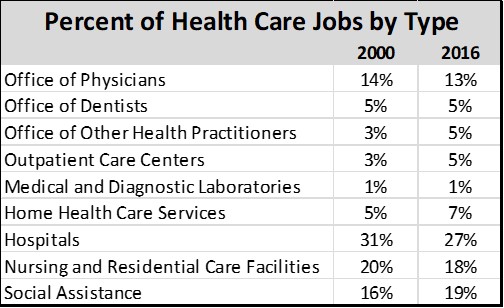
Office of Physicians Office of Dentists Office of Other Health Practitioners Outpatient Care Centers Medical and Diagnostic Laboratories Home Health Care Services Hospitals Nursing and Residential Care Facilities Social Assistance Payroll Totals* 2000 2016 1,801.1 2,527.7 687.7 925.8 438.1 858.6 425.2 856.3 161.9 262.8 633.3 1,362.0 3,954.3 5,024.9 2,583.2 3,313.7 2,003.3 3,635.9 Change Total* Percentage 726.6 40% 238.1 35% 420.5 96% 431.1 101% 100.9 62% 728.7 115% 1,070.6 27% 730.5 28% 1,632.6 81% ALL Health Care Jobs 12,688.1 '18,767. 7 6 ,079.6 48% 5% Percent of Health Care Jobs by Type 2000 2016 Office of Physicians 14% 13% Office of Dentists 5% Office of Other Health Practitioners 3% 5% Outpatient Care Centers 3% 5% Medical and Diagnostic Laboratories 1% 1% Home Health Care Services 5% 7% Hospitals 31% 27% Nursing and Residential Care Facilities 20% 18% Social Assistance 16% 19%Step by Step Solution
There are 3 Steps involved in it
1 Expert Approved Answer
Step: 1 Unlock

Question Has Been Solved by an Expert!
Get step-by-step solutions from verified subject matter experts
Step: 2 Unlock
Step: 3 Unlock