

Question: 11. PLEASE HELP The box plots below show the math scores of students in two different classes: Class A Class B 50 55 60 65
11. PLEASE HELP
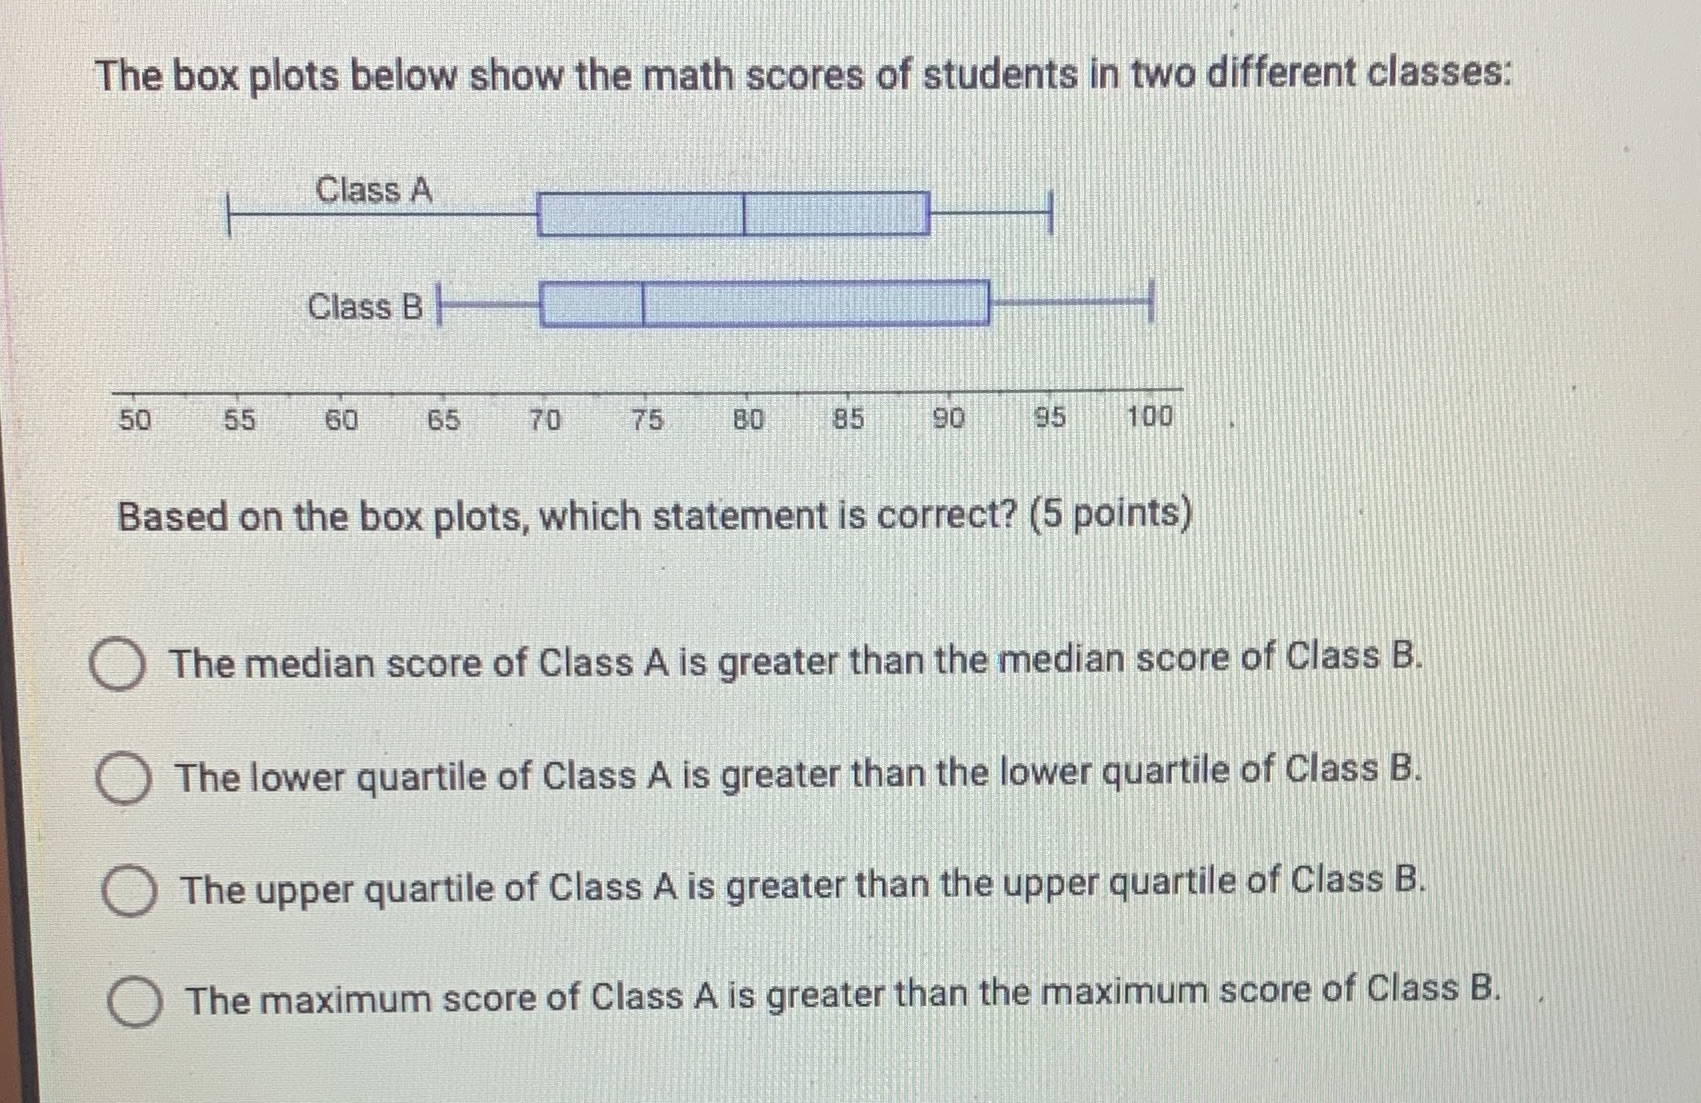
The box plots below show the math scores of students in two different classes: Class A Class B 50 55 60 65 70 75 85 90 95 100 Based on the box plots, which statement is correct? (5 points) The median score of Class A is greater than the median score of Class B. The lower quartile of Class A is greater than the lower quartile of Class B. O The upper quartile of Class A is greater than the upper quartile of Class B. The maximum score of Class A is greater than the maximum score of Class B
Step by Step Solution
There are 3 Steps involved in it
1 Expert Approved Answer
Step: 1 Unlock

Question Has Been Solved by an Expert!
Get step-by-step solutions from verified subject matter experts
Step: 2 Unlock
Step: 3 Unlock