

Question: 11. Use the graph below to answer the questions that follow. Driving Speed and Fuel Consumption 25 20 15 Fuel Consumption (L/100 km) 10 10
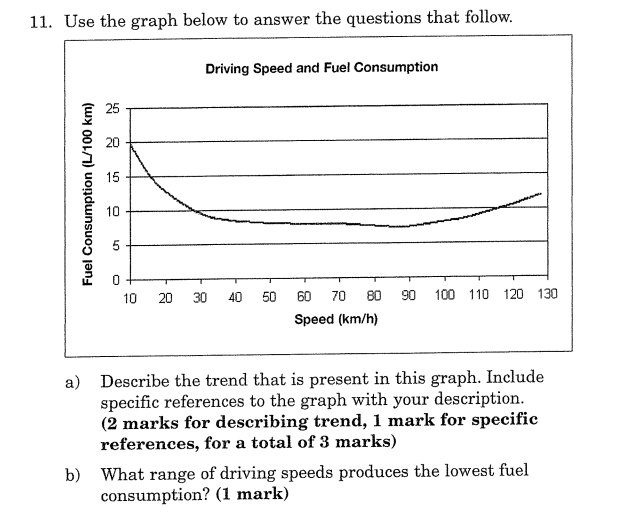
11. Use the graph below to answer the questions that follow. Driving Speed and Fuel Consumption 25 20 15 Fuel Consumption (L/100 km) 10 10 20 30 40 50 60 70 80 90 100 110 120 130 Speed (km/h) a) Describe the trend that is present in this graph. Include specific references to the graph with your description. (2 marks for describing trend, 1 mark for specific references, for a total of 3 marks) b) What range of driving speeds produces the lowest fuel consumption? (1 mark)
Step by Step Solution
There are 3 Steps involved in it
1 Expert Approved Answer
Step: 1 Unlock

Question Has Been Solved by an Expert!
Get step-by-step solutions from verified subject matter experts
Step: 2 Unlock
Step: 3 Unlock