

Question: 1.(10 points) Use Columns C and D for this question. You are measuring weight loss using the same set of people at different times C
1.(10 points) Use Columns C and D for this question.
You are measuring weight loss using the same set of people at different times C and D. You want to know whether there is any difference in the weight between the start of the diet and the end of the diet. Column C gives the weight at the beginning of diet time. Column D gives the weight for the SAME person at the end of the diet time. Since there is data for the same person at different times, we will test whether (C-D) 0 (meaning the diet did cause weight loss) since we have correlated data (matched pairs).
Use Summary 5b, Table 2, Column 1
a.Make a new series of data samples by letting E = C - D. List your new series of 10 numbers.
b.What is the null hypothesis H0 ?
c.What is the alternative hypothesis Ha ?
d.What type of tail test are we going to use? (left tail, right tail, two tail)
e.What is the mean xbar of this new sample?
f.What is the standard deviation of the sample s?
g.What is the size of the sample n?
h.How many degrees of freedom does this data set have?
i.What is the t-statistic for this sample?
j.Use the t-distribution calculator to compute a p-value. Show a screen shot of your answer.
k.Based on this value of p and using a 90% confidence level, is there a systematic difference in the weight changes between the start and stop time of the diet? Should we accept or reject the null hypothesis?
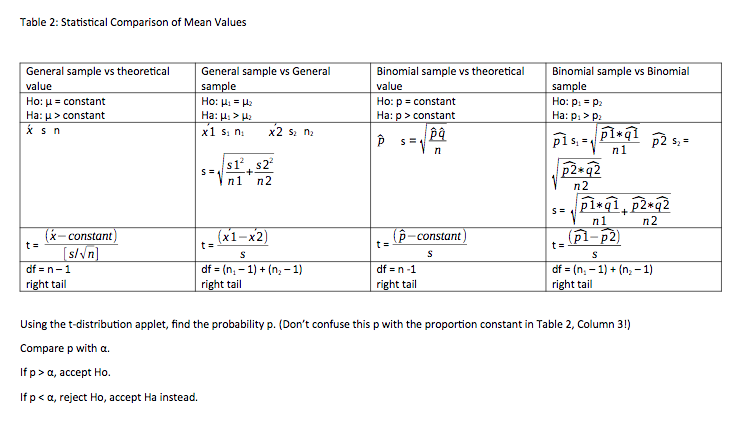
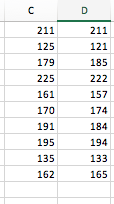
Table 2: Statistical Comparison of Mean Values General sample vs theoretical General sample vs General Binomial sample vs theoretical Binomial sample vs Binomial value sample value sample Ho: HI = constant Ho: Hi = Hz Ho: p = constant Ho: P1 = P2 Ha: u > constant Ha: J: > W Ha: p > constant Ha: p1 > p xsn x1 s n x 2 S. n2 pis = p1*q1 p2 s, = s1 , $2- n1 n2 p2* 92 n2 5= pi* q1, p2*92 n 2 t = x - constant s/ vn] t = (x1-x2) [ p-constant t= (p1- p2) S S S of = n- 1 df = (n, - 1) + (n, - 1) df = n -1 df = (n, - 1) + (n> -1) right tail right tail right tail right tail Using the t-distribution applet, find the probability p. (Don't confuse this p with the proportion constant in Table 2, Column 3!) Compare p with a. If p > a, accept Ho. If p
Step by Step Solution
There are 3 Steps involved in it

Get step-by-step solutions from verified subject matter experts