

Question: 12 #4 4. Drawing a yield curve Given the indicated maturities listed in the following table, assume the following yields for US Treasury securities: 5
12 #4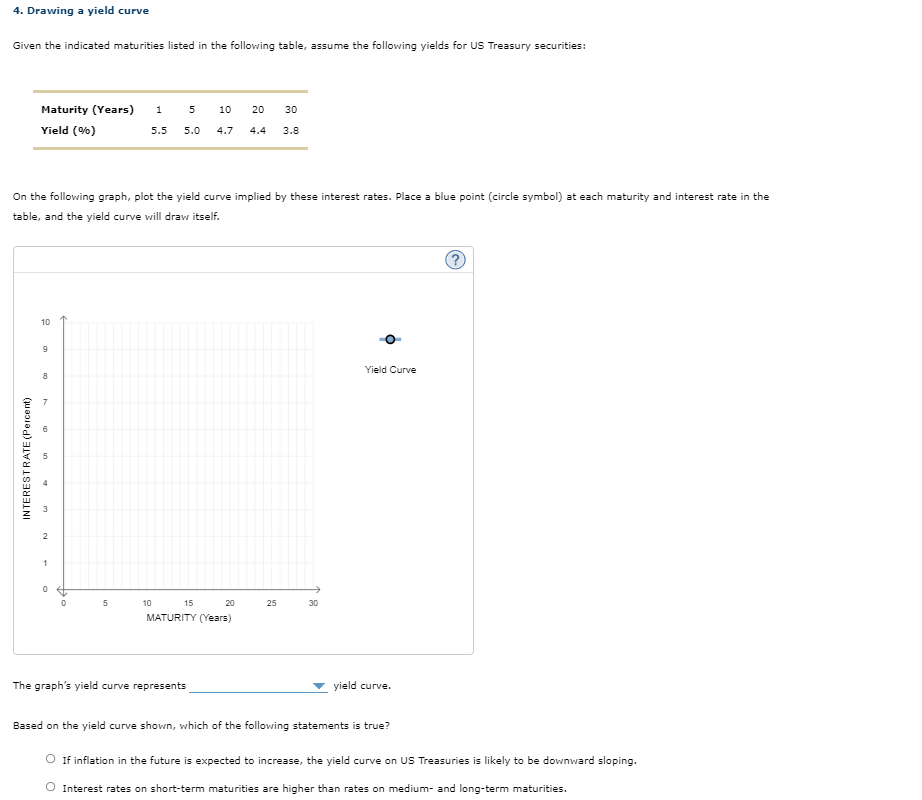
4. Drawing a yield curve Given the indicated maturities listed in the following table, assume the following yields for US Treasury securities: 5 10 20 30 Maturity (Years) 1 Yield (%) 5.5 5.0 4.7 4.4 3.8 On the following graph, plot the yield curve implied by these interest rates. Place a blue point (circle symbol) at each maturity and interest rate in the table, and the yield curve will draw itself. 10 9 Yield Curve 8 INTEREST RATE (Percent) N 10 15 20 MATURITY (Years) (~. 30 1 0 5 25 The graph's yield curve represents yield curve. Based on the yield curve shown, which of the following statements is true? O If inflation in the future is expected to increase, the yield curve on US Treasuries is likely to be downward sloping. Interest rates on short-term maturities are higher than rates on medium- and long-term maturities
Step by Step Solution
There are 3 Steps involved in it

Get step-by-step solutions from verified subject matter experts