

Question: 12. Describe the error in regression for this scatter plot. {2 marks] 13. A market research rm surveyed several Change in Change in advertisers to
![marks] 13. A market research rm surveyed several Change in Change in](https://dsd5zvtm8ll6.cloudfront.net/si.experts.images/questions/2024/09/66f70a5c2c0b6_07666f70a5c18945.jpg)
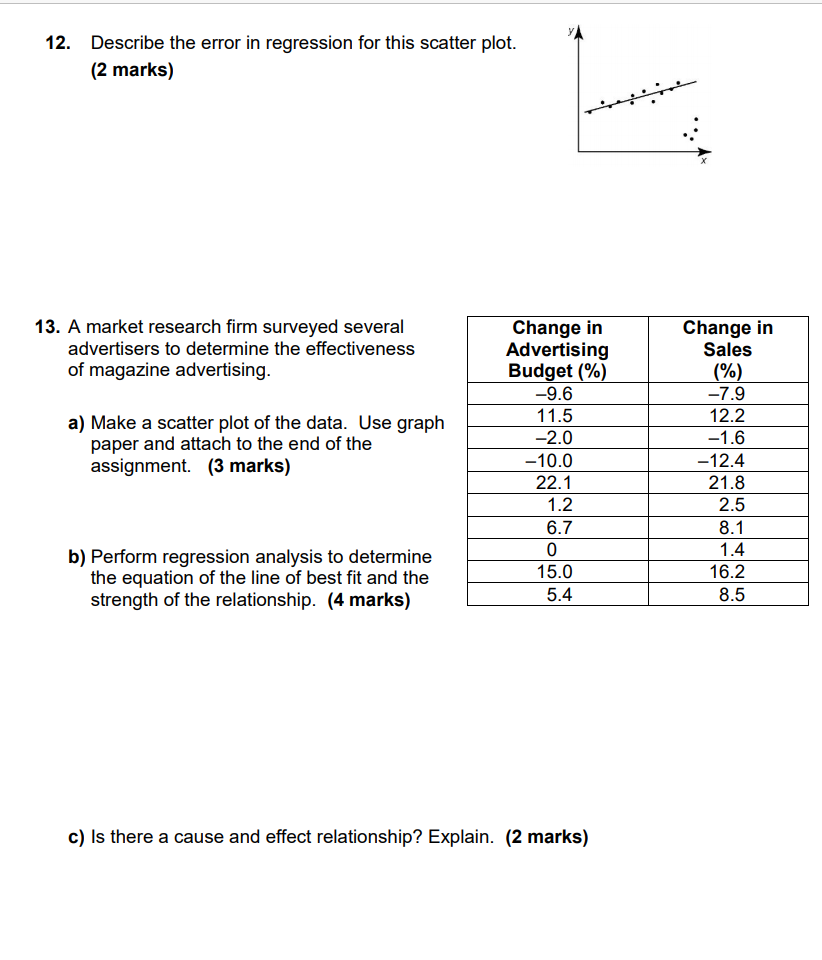
12. Describe the error in regression for this scatter plot. {2 marks] 13. A market research rm surveyed several Change in Change in advertisers to determine the effecveness Advertising Sales of magazine advertising. Budget {'93) {"13} a) Make a scatter plot of the data. Use graph paper and attach to the end of the assignment. {3 marks) b] Perform regression analysis to determine the equation of the line of best fit and the strength of the relationship. {4 marks) c] Is there a cause and effect relationship? Explain. {2 marks) 9. Make a scatter plot associated with each value of the correlation coefficient. {3 marks} a} r=1 at b} r: 0.5 c} r= {}.9 y
Step by Step Solution
There are 3 Steps involved in it

Get step-by-step solutions from verified subject matter experts