

Question: 12) Quantify the visual distortion in the chart below between the Tesla stock price on Apr 2, 2018 (252) and the Tesla stock price on
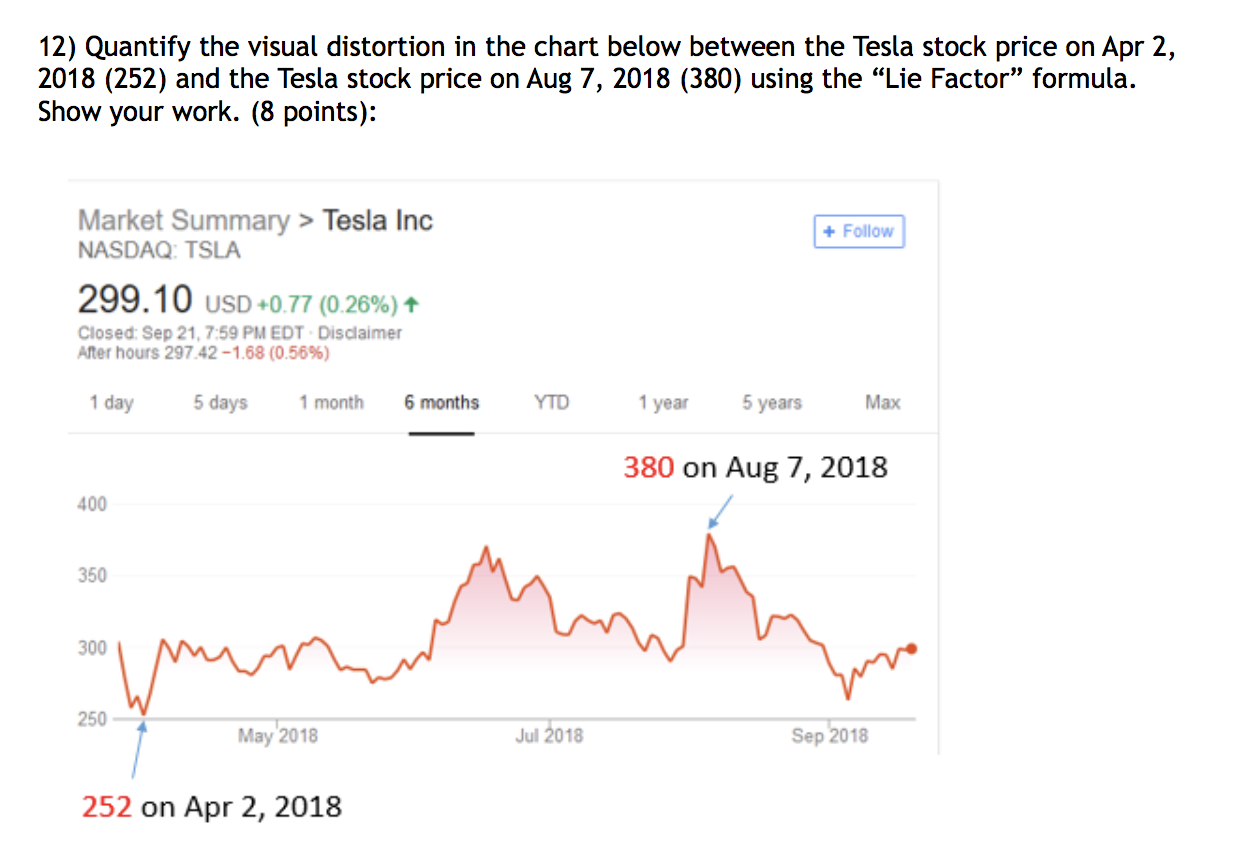
12) Quantify the visual distortion in the chart below between the Tesla stock price on Apr 2, 2018 (252) and the Tesla stock price on Aug 7, 2018 (380) using the Lie Factor" formula. Show your work. (8 points): + Follow Market Summary > Tesla Inc NASDAQ: TSLA 299.10 USD +0.77 (0.26%) + Closed: Sep 21, 7:59 PM EDT Disclaimer After hours 297.42-168 (0.56%) 1 day 5 days 1 month 6 months YTD 1 year 5 years Max 380 on Aug 7, 2018 400 350 300 mur mo 250 May 2018 Jul 2018 Sep 2018 252 on Apr 2, 2018 12) Quantify the visual distortion in the chart below between the Tesla stock price on Apr 2, 2018 (252) and the Tesla stock price on Aug 7, 2018 (380) using the Lie Factor" formula. Show your work. (8 points): + Follow Market Summary > Tesla Inc NASDAQ: TSLA 299.10 USD +0.77 (0.26%) + Closed: Sep 21, 7:59 PM EDT Disclaimer After hours 297.42-168 (0.56%) 1 day 5 days 1 month 6 months YTD 1 year 5 years Max 380 on Aug 7, 2018 400 350 300 mur mo 250 May 2018 Jul 2018 Sep 2018 252 on Apr 2, 2018
Step by Step Solution
There are 3 Steps involved in it

Get step-by-step solutions from verified subject matter experts