

Question: 12. The following table contains time series data for regular gasoline prices in the United States for 36 consecutive months: Month 2 3 5 file
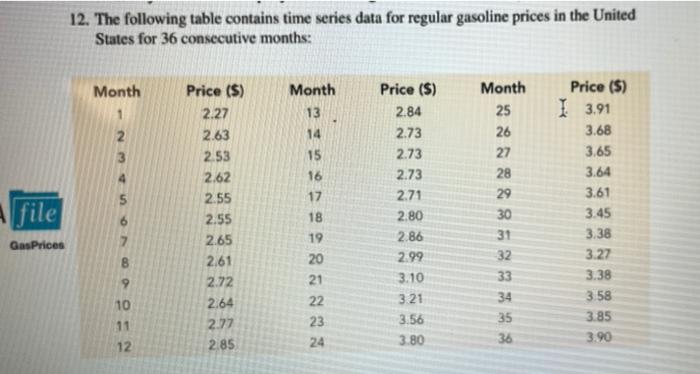
12. The following table contains time series data for regular gasoline prices in the United States for 36 consecutive months: Month 2 3 5 file Price (5) 2.27 2.63 253 2.62 2.55 2.55 2.65 2,61 2.72 2.64 2.77 2.85 Month 13 14 15 16 17 18 19 20 21 22 23 24 Price ($) 2.84 2.73 2.73 2.73 2.71 2.80 2.86 2.99 3.10 3.21 3.56 3.80 Month 25 26 27 28 29 30 31 32 33 34 35 36 Price (5) I 3.91 3.68 3.65 3.64 3.61 3.45 3.38 3.27 3.38 3.58 3.85 3.90 Gas Prices 10 11 12 a. Create a line chart for these time series data. What interpretations can you make about the average price per gallon of conventional regular gasoline over these 36 months? b. Fit a linear trendline to the data. What does the trendline indicate about the price of gasoline over these 36 months
Step by Step Solution
There are 3 Steps involved in it

Get step-by-step solutions from verified subject matter experts