Question: 12 X v fx C D E G H M N P B # Menu Item Contribution Menu Item Number Items Sold Menu Mix %
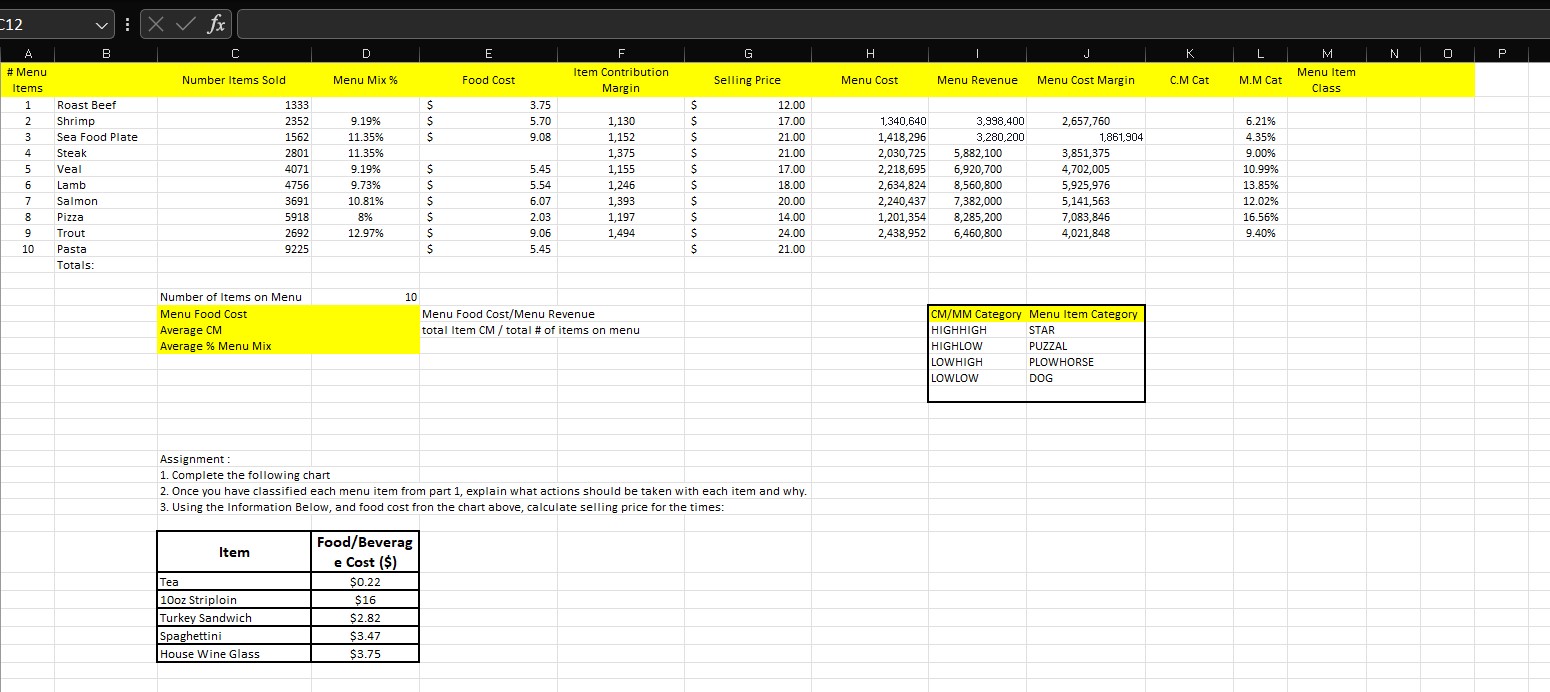
12 X v fx C D E G H M N P B # Menu Item Contribution Menu Item Number Items Sold Menu Mix % Food Cost Selling Price Menu Cost Menu Revenue Menu Cost Margin C.M Cat M.M Cat Items Margin Class 1 Roast Beef 1333 3.75 12.00 Shrimp 2352 9.19% 5.70 1,130 17.00 1,340,640 3,998,400 2,657,760 6.21% in in in Sea Food Plate 1562 11.35% .08 1,152 21.00 1,418,296 3,280,200 1,861,904 4.35% 15 WN Steak 2801 11.35% 21.00 2,030,725 5,882,100 3,851,375 9.00% Veal 4071 9.19% 5.45 1,155 17.00 2,218,695 6,920,700 4,702,005 10.99% Lamb 4756 9.73% 5.54 1,246 18.00 2,634,824 8,560,800 5,925,976 13.85% Salmon 3691 10.81% 6.07 1,393 20.00 2,240,437 7,382,000 5,141,563 12.02% Pizza 5918 8% 2.03 1,197 14.00 1,201,354 8,285,200 7,083,846 16.56% Trout 2692 12.97% 9.06 1,494 24.00 2,438,952 6,460,800 4,021,848 9.40% 10 Pasta 9225 5.45 21.00 Totals: Number of Items on Menu 10 Menu Food Cost Menu Food Cost/Menu Revenue CM/MM Category Menu Item Category Average CM total Item CM / total # of items on menu HIGHHIGH STAR Average % Menu Mix HIGHLOW PUZZAL LOWHIGH PLOWHORSE LOWLOW DOG Assignment : 1. Complete the following chart 2. Once you have classified each menu item from part 1, explain what actions should be taken with each item and why. 3. Using the Information Below, and food cost fron the chart above, calculate selling price for the times: Food/Beverag Item e Cost ($) Tea 60.2 10oz Striploin $16 Turkey Sandwich $2.82 Spaghettini $3.47 House Wine Glass $3.75
Step by Step Solution
There are 3 Steps involved in it
1 Expert Approved Answer
Step: 1 Unlock
Question Has Been Solved by an Expert!
Get step-by-step solutions from verified subject matter experts
Step: 2 Unlock
Step: 3 Unlock
Students Have Also Explored These Related General Management Questions!