

Question: 120 100 80 E 60 A 40 20 PA B X 20 40 60 80 100 120 1. The graph above presents a convex PPC
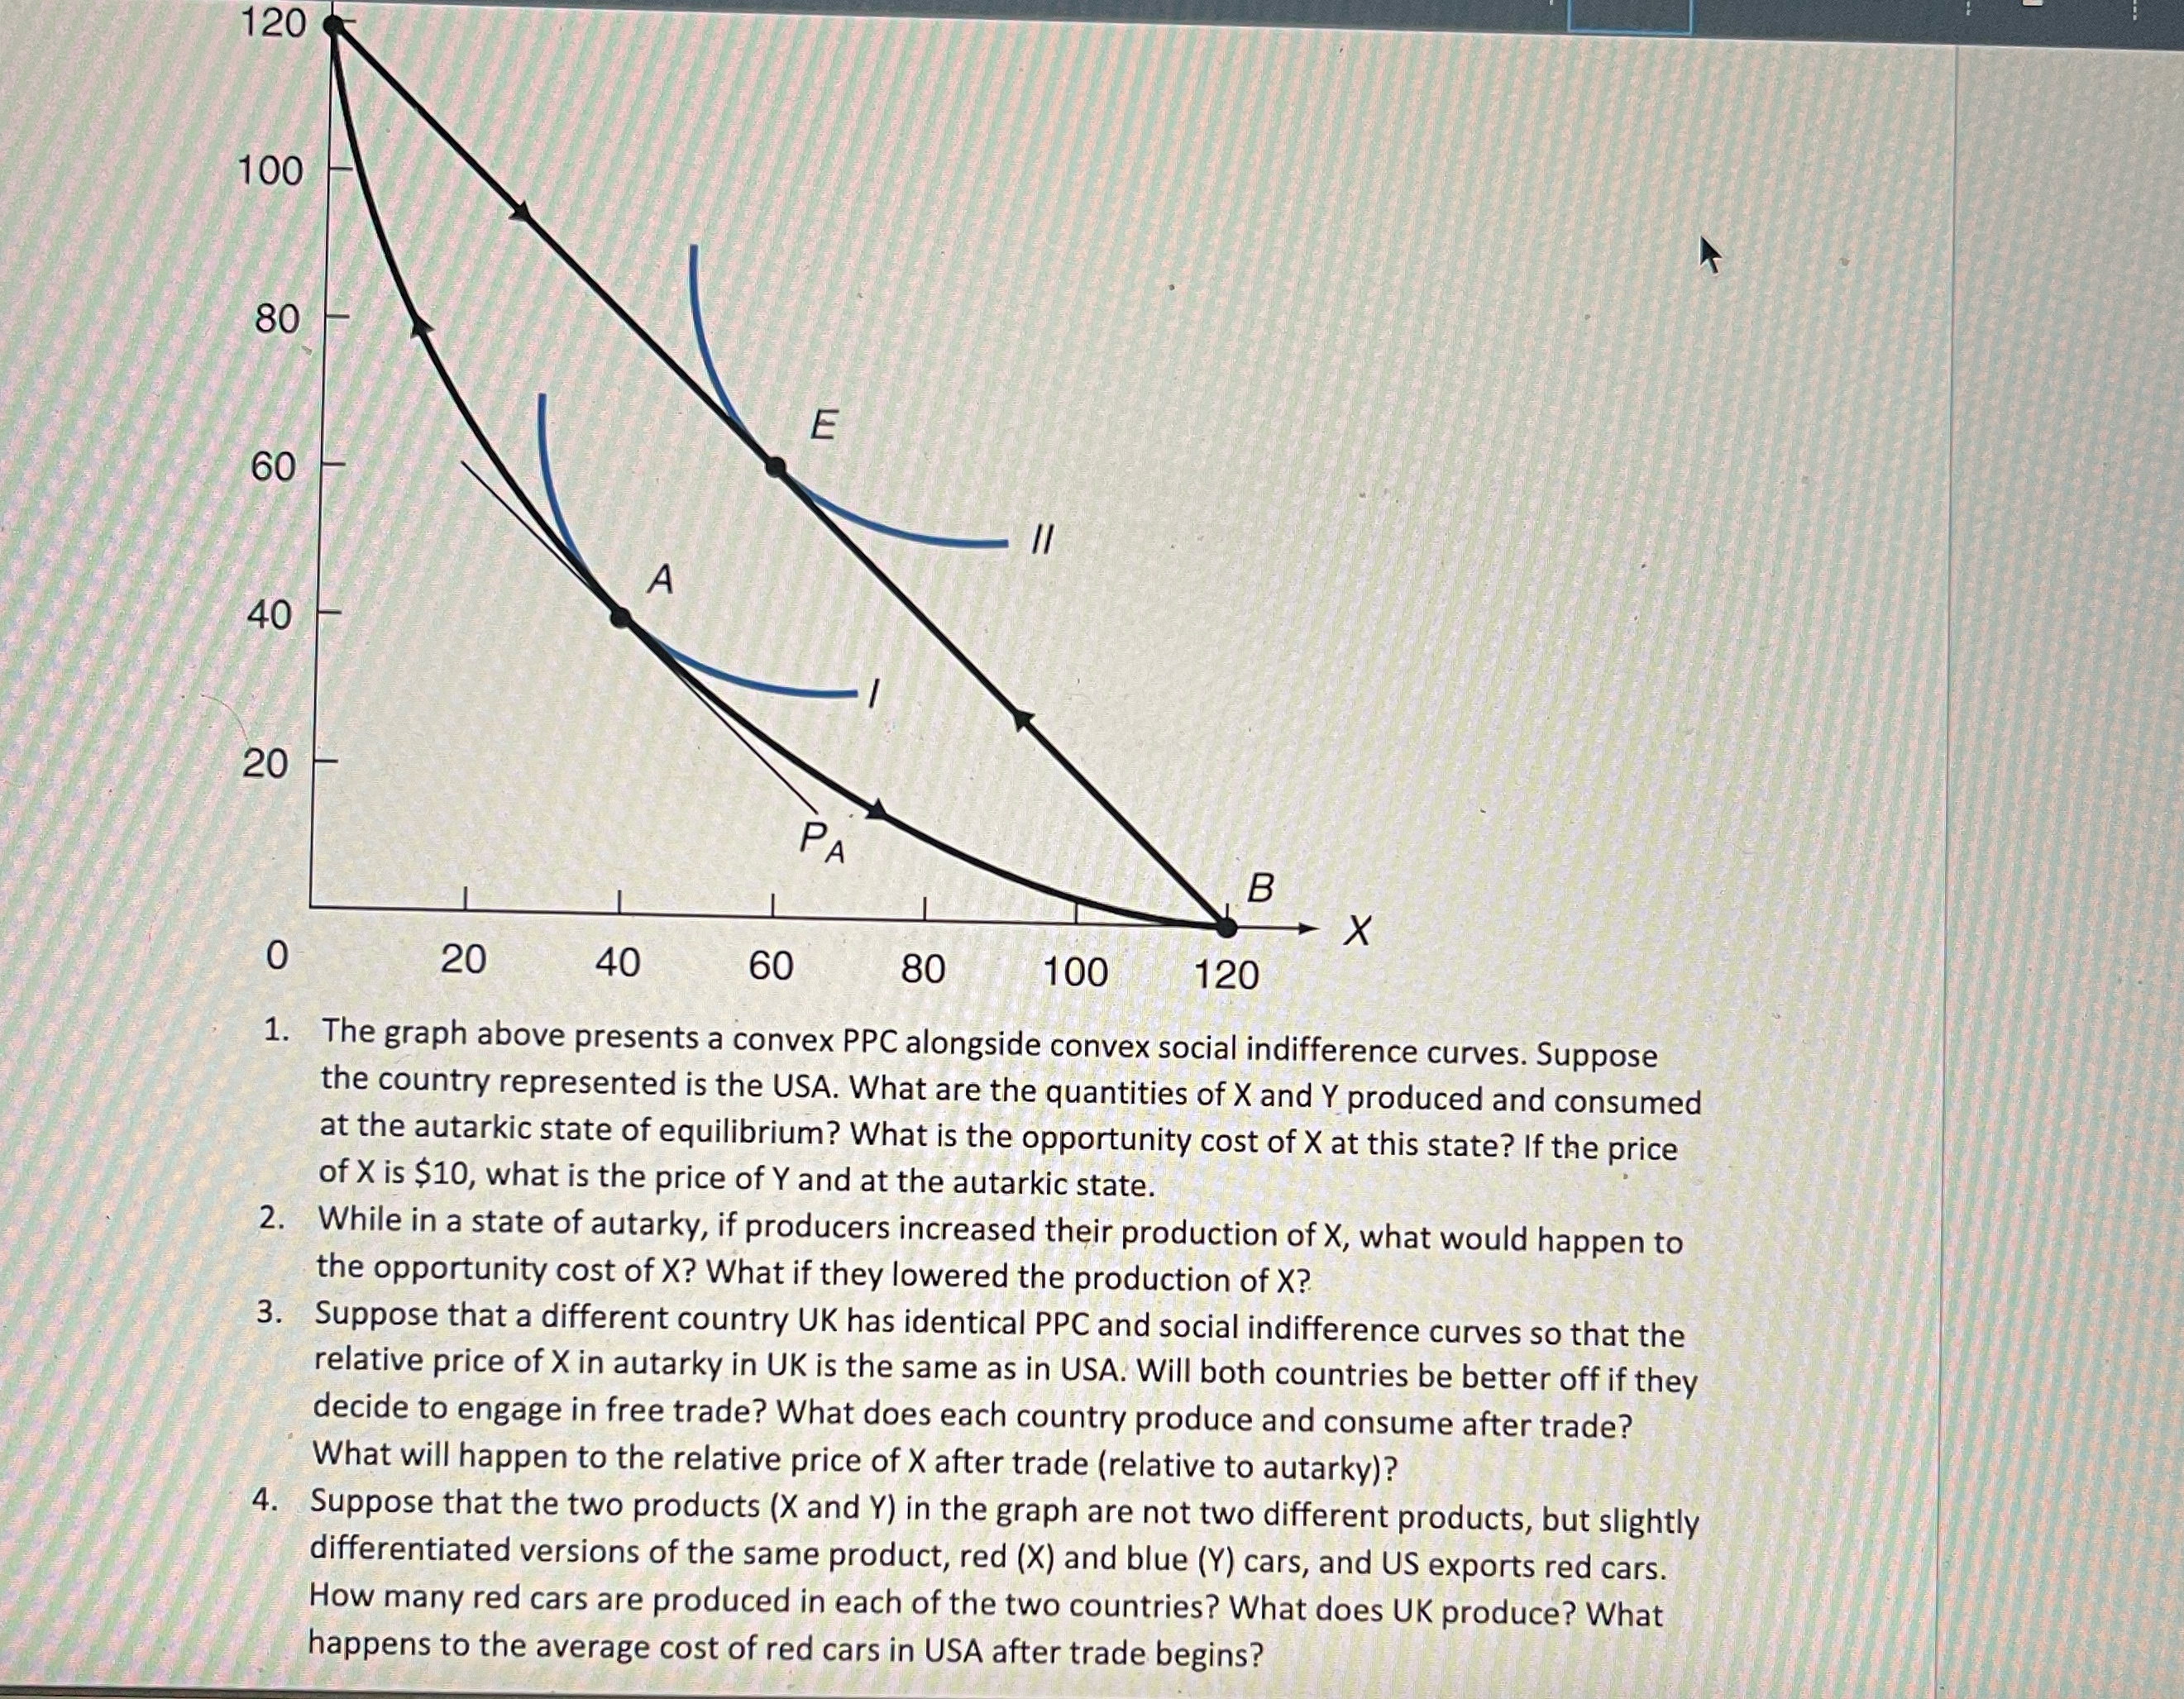
120 100 80 E 60 A 40 20 PA B X 20 40 60 80 100 120 1. The graph above presents a convex PPC alongside convex social indifference curves. Suppose the country represented is the USA. What are the quantities of X and Y produced and consumed at the autarkic state of equilibrium? What is the opportunity cost of X at this state? If the price of X is $10, what is the price of Y and at the autarkic state. 2. While in a state of autarky, if producers increased their production of X, what would happen to the opportunity cost of X? What if they lowered the production of X? 3. Suppose that a different country UK has identical PPC and social indifference curves so that the relative price of X in autarky in UK is the same as in USA. Will both countries be better off if they decide to engage in free trade? What does each country produce and consume after trade? What will happen to the relative price of X after trade (relative to autarky)? 4. Suppose that the two products (X and Y) in the graph are not two different products, but slightly differentiated versions of the same product, red (X) and blue (Y) cars, and US exports red cars. How many red cars are produced in each of the two countries? What does UK produce? What happens to the average cost of red cars in USA after trade begins
Step by Step Solution
There are 3 Steps involved in it

Get step-by-step solutions from verified subject matter experts