

Question: 120- height 110- 100= 50 headcirc Question S. Create a data file (in SPSS or Excel] that contains the following variables and values: VAR1: 3
![file (in SPSS or Excel] that contains the following variables and values:](https://s3.amazonaws.com/si.experts.images/answers/2024/06/667dfb59a3f75_377667dfb598ff49.jpg)
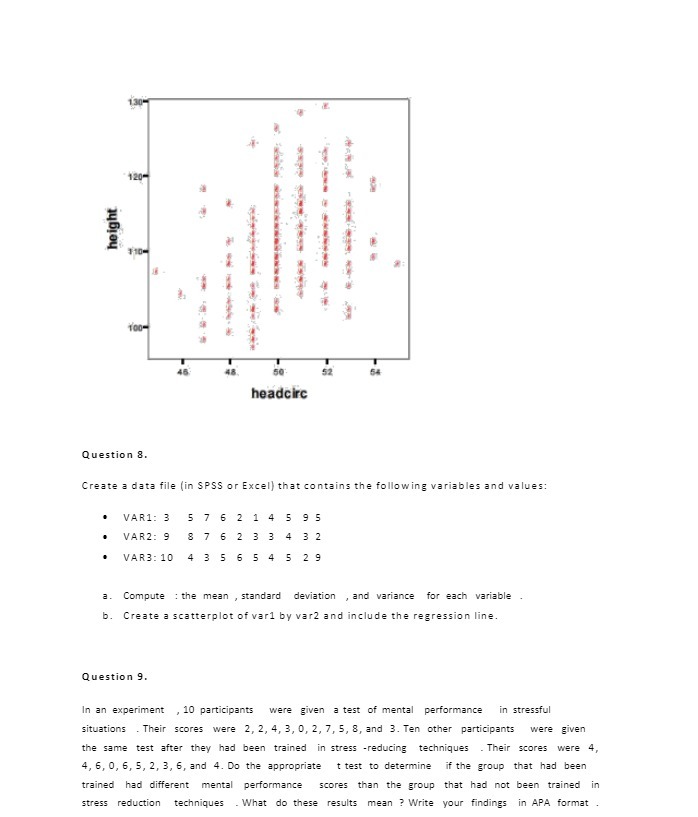
120- height 110- 100= 50 headcirc Question S. Create a data file (in SPSS or Excel] that contains the following variables and values: VAR1: 3 2 1 4 9 5 VAR2: 9 76 2 3 3 4 3 2 VAR3: 10 4 3 5 6 5 4 5 1 9 a. Compute : the mean , standard deviation , and variance for each variable b. Create a scatterplot of vari by var2 and include the regression line. Question 9. In an experiment , 10 participants were given a test of mental performance in stressful situations . Their scores were 2, 2, 4, 3, 0, 2, 7, 5, 8, and 3. Ten other participants were given the same test after they had been trained in stress -reducing techniques . Their scores were 4, 4, 6, 0, 6, 5, 2, 3, 6, and 4. Do the appropriate t test to determine if the group that had been trained had different mental performance scores than the group that had not been trained in stress reduction techniques . What do these results mean ? Write your findings in APA format
Step by Step Solution
There are 3 Steps involved in it

Get step-by-step solutions from verified subject matter experts