

12-104. Tables 12-23 and 12-24 present statistics for the Major League Baseball 2005 season (source: The...
Fantastic news! We've Found the answer you've been seeking!
Question:
Transcribed Image Text:
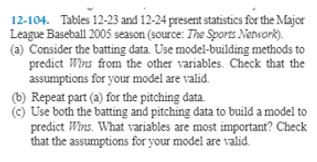
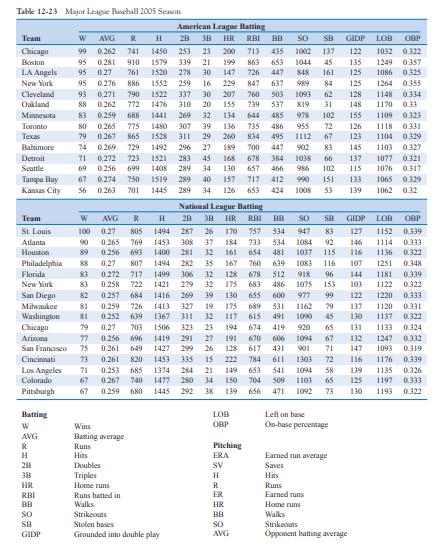
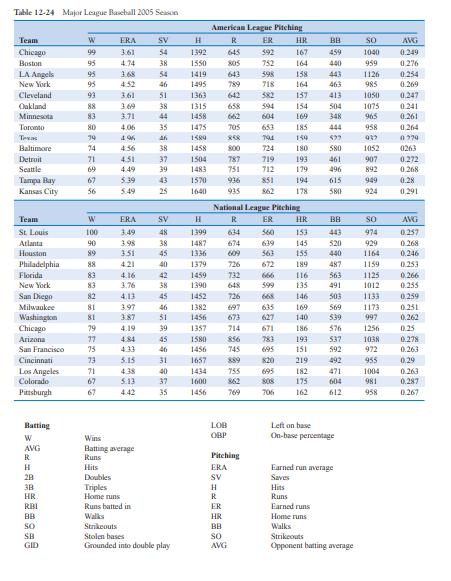
12-104. Tables 12-23 and 12-24 present statistics for the Major League Baseball 2005 season (source: The Sports Network). (a) Consider the batting data. Use model-building methods to predict Wins from the other variables. Check that the assumptions for your model are valid. (b) Repeat part (a) for the pitching data. (c) Use both the batting and pitching data to build a model to predict Wins. What variables are most important? Check that the assumptions for your model are valid. Table 12-23 Major League Baseball 2005 Season American League Batting Team W AVG 28 38 HR RBI BB SO SB GIDP LOB OBP Chicago 99 0.262 741 1450 253 23 200 713 435 1002 137 122 1032 0322 Boston 95 0.281 910 1579 339 21 199 863 653 1044 45 135 1249 0.357 LA Angels 95 0.27 761 1520 278 30 147 726 447 848 161 125 1086 0325 New York 95 0.276 886 1552 259 16 229 847 637 989 84 125 1264 0355 Cleveland 93 0.271 790 1522 337 30 207 760 503 1093 62 128 1148 0334 Oakland 88 0.262 772 1476 310 20 155 739 537 819 31 148 1170 033 Minnesota 83 0.259 688 1441 269 32 134 644 485 978 102 155 1109 0323 Toronto 80 0.265 775 1480 307 39 136 735 486 955 72 126 1118 0331 Texas 79 0.267 865 1528 311 29 260 834 495 J112 67 123 1104 0329 Baltimore 74 0.269 729 1492 296 27 189 700 447 902 83 145 1103 0327 Detroit 71 0.272 0.256 723 1521 283 45 168 678 384 1038 66 137 1077 0321 Seattle 69 699 1408 289 34 130 657 466 986 102 115 1076 0317 Tampa Hay Kansas City 67 0.274 750 1519 289 40 157 717 412 990 151 133 1065 0329 56 0.263 701 1445 289 34 126 653 424 1008 3 139 1062 0.32 National League Batting Team AVG R H 28 3B HR RBI SO GIDP LOB OBP St. Louis 100 0.27 287 170 757 334 947 83 127 1152 0.339 Atlanta Houston 90 0.265 769 1453 308 37 184 733 534 1084 92 146 1114 0.333 0.256 693 1400 281 32 161 654 481 1037 115 116 1136 0.322 Philadelphia Florida New York 0.27 807 1494 282 35 167 760 639 1083 116 107 1251 0.348 83 0.272 717 1499 306 32 128 678 512 918 96 144 1181 0.339 83 0.258 722 1421 279 32 175 683 486 1075 153 103 1122 0.322 San Diego 82 0.257 684 1416 269 39 130 655 600 977 99 122 1220 0.333 Milwaukee 81 0.259 726 1413 327 19 175 689 331 1162 79 137 1120 0.331 Washington Chicago 81 0.252 639 1367 311 32 117 615 491 1090 45 130 1137 0.322 79 0.27 703 1506 323 23 194 674 419 920 65 131 1133 0.324 Arizona 77 0.256 696 1419 291 27 191 670 606 1094 67 132 1247 0.332 San Francisco 75 0.261 649 1427 299 26 128 617 431 901 71 147 1093 0.319 Cincinnati 73 0.261 820 1453 335 15 222 784 611 1303 72 116 1176 0.339 Los Angeles Colorado 71 0.253 685 1374 284 21 149 633 541 1094 58 139 1135 0.326 67 0.267 740 1477 280 34 150 704 309 1103 65 125 1197 0.333 Pitsburgh 67 0.259 680 1445 292 38 139 656 471 1092 73 130 1193 0.322 Batting LOB Left on hase Wins OBP On-base percentage AVG Batting average Runs Hits Pitching ERA sV R Earned run average 28 Doubles Saves 3B Triples Home runs H Hits Runs Earned runs HR R ER RBI BB Runs batted in Walks HR Home runs SO Strikeouts BB Walks Stolen bases Strikeouts GIDP Grounded into double play AVG Opponent batting average Table 12-24 Major League Baseball 2005 Season American League Pitching so Team Chicago ERA SV R ER HR BB AVG 99 3.61 54 1392 645 592 167 459 1040 0.249 Boston 95 4.74 38 1550 805 752 164 440 959 0276 LA Angels 95 368 54 1419 643 598 158 443 1126 0.254 New York 95 4.52 46 1495 789 718 164 463 985 0.269 Cleveland 93 3.61 51 1363 642 582 157 413 1050 0.247 Oakland 88 369 38 1315 1458 658 594 154 504 1075 0241 Minnesota 83 主71 44 662 604 169 348 965 0.261 Toronto 80 4.06 35 1475 705 653 185 444 958 0264 Tevas 99 496 159 Baltinsore 74 4.36 38 1458 800 724 180 580 1052 0263 Detroit 71 4.51 37 1504 787 719 193 461 907 0.272 Seattle 69 4.49 39 1483 751 712 179 496 892 0.268 0.28 Tampa Bay Kansas City 67 539 43 1570 936 851 194 615 949 56 5.49 25 1640 935 862 178 580 924 0.291 National League Pitching Team ERA SV H R ER HR BB SO AVG St Louis 100 3.49 48 1399 634 560 153 443 974 0.257 Atlanta 90 3.98 38 1487 674 639 145 520 929 0.268 Houston Philadelphia Florida 89 351 45 1336 609 563 155 440 1164 0.246 88 421 40 1379 726 672 189 487 1159 0.253 0.266 0.255 83 4.16 42 1459 732 666 16 563 1125 1012 New York 83 3.76 38 1390 648 599 135 491 San Diego Milwaukee 82 4.13 45 1452 726 668 146 503 1133 0.259 81 3.97 46 1382 697 635 169 569 1173 0.251 0.262 Washingkon Chicago 81 3.87 51 1456 673 627 140 539 997 79 4.19 39 1357 714 671 186 576 1256 0.25 Arizona 77 4.84 45 1580 856 783 193 537 1038 0.278 San Francisco 75 433 46 1456 745 695 151 592 972 0.263 Cincinnati 73 5.15 31 1657 889 820 219 492 955 0.29 1004 Los Angeles Colorado 71 4.38 40 1434 755 695 182 471 0.263 67 3.13 37 1600 862 175 604 981 0.287 Pittsburgh 67 4.42 35 1456 769 706 162 612 958 0.267 Batting LOB Left on hase Wins OBP On-base percentage AVG R Batting average Runs Pitching H Hits ERA Earned run average 28 Doubles SV Saves 38 HR Tпples Home nuns Hits Runs R RBI Runs batted in ER Earned runs BB Walks HR Ноme runs SO Strikeouts BB Walks SO AVG Stolen bases Strikeouts GID Grounded into double play Opponent batting average 12-104. Tables 12-23 and 12-24 present statistics for the Major League Baseball 2005 season (source: The Sports Network). (a) Consider the batting data. Use model-building methods to predict Wins from the other variables. Check that the assumptions for your model are valid. (b) Repeat part (a) for the pitching data. (c) Use both the batting and pitching data to build a model to predict Wins. What variables are most important? Check that the assumptions for your model are valid. Table 12-23 Major League Baseball 2005 Season American League Batting Team W AVG 28 38 HR RBI BB SO SB GIDP LOB OBP Chicago 99 0.262 741 1450 253 23 200 713 435 1002 137 122 1032 0322 Boston 95 0.281 910 1579 339 21 199 863 653 1044 45 135 1249 0.357 LA Angels 95 0.27 761 1520 278 30 147 726 447 848 161 125 1086 0325 New York 95 0.276 886 1552 259 16 229 847 637 989 84 125 1264 0355 Cleveland 93 0.271 790 1522 337 30 207 760 503 1093 62 128 1148 0334 Oakland 88 0.262 772 1476 310 20 155 739 537 819 31 148 1170 033 Minnesota 83 0.259 688 1441 269 32 134 644 485 978 102 155 1109 0323 Toronto 80 0.265 775 1480 307 39 136 735 486 955 72 126 1118 0331 Texas 79 0.267 865 1528 311 29 260 834 495 J112 67 123 1104 0329 Baltimore 74 0.269 729 1492 296 27 189 700 447 902 83 145 1103 0327 Detroit 71 0.272 0.256 723 1521 283 45 168 678 384 1038 66 137 1077 0321 Seattle 69 699 1408 289 34 130 657 466 986 102 115 1076 0317 Tampa Hay Kansas City 67 0.274 750 1519 289 40 157 717 412 990 151 133 1065 0329 56 0.263 701 1445 289 34 126 653 424 1008 3 139 1062 0.32 National League Batting Team AVG R H 28 3B HR RBI SO GIDP LOB OBP St. Louis 100 0.27 287 170 757 334 947 83 127 1152 0.339 Atlanta Houston 90 0.265 769 1453 308 37 184 733 534 1084 92 146 1114 0.333 0.256 693 1400 281 32 161 654 481 1037 115 116 1136 0.322 Philadelphia Florida New York 0.27 807 1494 282 35 167 760 639 1083 116 107 1251 0.348 83 0.272 717 1499 306 32 128 678 512 918 96 144 1181 0.339 83 0.258 722 1421 279 32 175 683 486 1075 153 103 1122 0.322 San Diego 82 0.257 684 1416 269 39 130 655 600 977 99 122 1220 0.333 Milwaukee 81 0.259 726 1413 327 19 175 689 331 1162 79 137 1120 0.331 Washington Chicago 81 0.252 639 1367 311 32 117 615 491 1090 45 130 1137 0.322 79 0.27 703 1506 323 23 194 674 419 920 65 131 1133 0.324 Arizona 77 0.256 696 1419 291 27 191 670 606 1094 67 132 1247 0.332 San Francisco 75 0.261 649 1427 299 26 128 617 431 901 71 147 1093 0.319 Cincinnati 73 0.261 820 1453 335 15 222 784 611 1303 72 116 1176 0.339 Los Angeles Colorado 71 0.253 685 1374 284 21 149 633 541 1094 58 139 1135 0.326 67 0.267 740 1477 280 34 150 704 309 1103 65 125 1197 0.333 Pitsburgh 67 0.259 680 1445 292 38 139 656 471 1092 73 130 1193 0.322 Batting LOB Left on hase Wins OBP On-base percentage AVG Batting average Runs Hits Pitching ERA sV R Earned run average 28 Doubles Saves 3B Triples Home runs H Hits Runs Earned runs HR R ER RBI BB Runs batted in Walks HR Home runs SO Strikeouts BB Walks Stolen bases Strikeouts GIDP Grounded into double play AVG Opponent batting average Table 12-24 Major League Baseball 2005 Season American League Pitching so Team Chicago ERA SV R ER HR BB AVG 99 3.61 54 1392 645 592 167 459 1040 0.249 Boston 95 4.74 38 1550 805 752 164 440 959 0276 LA Angels 95 368 54 1419 643 598 158 443 1126 0.254 New York 95 4.52 46 1495 789 718 164 463 985 0.269 Cleveland 93 3.61 51 1363 642 582 157 413 1050 0.247 Oakland 88 369 38 1315 1458 658 594 154 504 1075 0241 Minnesota 83 主71 44 662 604 169 348 965 0.261 Toronto 80 4.06 35 1475 705 653 185 444 958 0264 Tevas 99 496 159 Baltinsore 74 4.36 38 1458 800 724 180 580 1052 0263 Detroit 71 4.51 37 1504 787 719 193 461 907 0.272 Seattle 69 4.49 39 1483 751 712 179 496 892 0.268 0.28 Tampa Bay Kansas City 67 539 43 1570 936 851 194 615 949 56 5.49 25 1640 935 862 178 580 924 0.291 National League Pitching Team ERA SV H R ER HR BB SO AVG St Louis 100 3.49 48 1399 634 560 153 443 974 0.257 Atlanta 90 3.98 38 1487 674 639 145 520 929 0.268 Houston Philadelphia Florida 89 351 45 1336 609 563 155 440 1164 0.246 88 421 40 1379 726 672 189 487 1159 0.253 0.266 0.255 83 4.16 42 1459 732 666 16 563 1125 1012 New York 83 3.76 38 1390 648 599 135 491 San Diego Milwaukee 82 4.13 45 1452 726 668 146 503 1133 0.259 81 3.97 46 1382 697 635 169 569 1173 0.251 0.262 Washingkon Chicago 81 3.87 51 1456 673 627 140 539 997 79 4.19 39 1357 714 671 186 576 1256 0.25 Arizona 77 4.84 45 1580 856 783 193 537 1038 0.278 San Francisco 75 433 46 1456 745 695 151 592 972 0.263 Cincinnati 73 5.15 31 1657 889 820 219 492 955 0.29 1004 Los Angeles Colorado 71 4.38 40 1434 755 695 182 471 0.263 67 3.13 37 1600 862 175 604 981 0.287 Pittsburgh 67 4.42 35 1456 769 706 162 612 958 0.267 Batting LOB Left on hase Wins OBP On-base percentage AVG R Batting average Runs Pitching H Hits ERA Earned run average 28 Doubles SV Saves 38 HR Tпples Home nuns Hits Runs R RBI Runs batted in ER Earned runs BB Walks HR Ноme runs SO Strikeouts BB Walks SO AVG Stolen bases Strikeouts GID Grounded into double play Opponent batting average
Expert Answer:

Related Book For 

Introduction to Mathematical Statistics and Its Applications
ISBN: 978-0321693945
5th edition
Authors: Richard J. Larsen, Morris L. Marx
Posted Date:
Students also viewed these accounting questions
-
What provisions in the agreement between the Major League Baseball Players Association (MLBPA) and the team owners began what is called "the modern era" of professional sports? Why? Do you agree it...
-
The Major League Baseball Players Association and the Major League Baseball Clubs resolved a dispute regarding labor practices by establishing a fund to be distributed to injured players. The...
-
For the Major League Baseball seasons from 1950 through 2008, there were fifty-nine nine-inning games in which one of the teams did not manage to get a hit. The data in the table give the number of...
-
Write a critical review paper on the topic of financial management in the broad sense.
-
Government plays a variety of roles in the Canadian mixed economy. Consider each of the roles discussed in the text and state the criteria you would use to decide whether government involvement in...
-
June 15, 2013-It has been two weeks since Covolo Diving Gear's contentious semiannual planning meeting, and the senior staff members for Covolo Diving Gear are getting ready to start their rst...
-
In the months leading up to the 2016 election, Christopher Steele, a former British intelligence agent, was hired by a Washington, D.C., research firm to investigate whether then-candidate Donald...
-
Three different plans for financing a $200,000,000 corporation are under consideration by its organizers. Under each of the following plans, the securities will be issued at their par or face amount,...
-
An owner arrives to collect her dog's prescription for ampicillin tablets. The dog weighs 23 kg and the dose of ampicillin suggested by the vet is 15 mg/kg/t.i.d. You have the tablets available in...
-
Change all of the numbers in the data area of your worksheet so that it looks like this: A 1 Chapter 3: Applying Excel 2 3 Data 4 Allocation base 5 Estimated manufacturing overhead cost 6 Estimated...
-
Company C is interested in using rates at capacity to better understand its costs of unused capacity. It expects to pay 146,000 in wages this year. In recent years, wages have ranged from a low of...
-
Sand and Gravel Company provides topsoil for three residential housing developments. Topsoil can be supplied from three different farms as follows: Farm Weekly capacity (cubic meter) A 100 B C 150...
-
Suppose a local catering company owes $15,000 on a van they just purchased for deliveries. The previous amount for owner's equity is $72,000. What must the new value for owner's equity be? Question 2...
-
Insurer A reports a combined ratio of 104 percent and an overall operating ratio of 98 percent in its year-end financial results. Insurer A is generating Available answer options Select only one...
-
If some sort of exception is thrown at line 34, which output is possible?
-
What is income smoothing? Question 7 options: Maximizing income for bonuses Reduction of earnings volatility over time Reporting a large loss Minimizing profit in periods where profitability is high
-
Organizational Behavior in Food Services Motivation Case Study Rosemary Johnson and Bob Forbes were returning from their meeting of the company's training program for food and nutrition managers when...
-
Borrowing costs should be recognised as an expense and charged to the profit and loss account of the period in which they are incurred : A. If the borrowing costs relate to qualifying asset B. If the...
-
A person exposed to an infectious agent, either by contact or by vaccination, normally develops antibodies to that agent. Presumably, the severity of an infection is related to the number of...
-
Construct a 95% confidence interval for 2X/2Y based on the data in Case Study 9.2.1. The hypothesis test referred to tacitly assumed that the variances were equal. Does that agree with your...
-
A medical study recently documented that 905 mistakes were made among the 289,411 prescriptions written during one year at a large metropolitan teaching hospital. Suppose a patient is admitted with a...
-
____________ refers to the chronic exhaustion from persistent workload, decreased motivation, and apathy toward work.
-
Can the risks and health consequences (for individuals and organizations) associated with difficult customers and coworkers be alleviated with employee education and training? What experiences have...
-
Employee ____________ is the loss or turnover of employees to other jobs and industries perceived as having healthier workplace cultures.

Study smarter with the SolutionInn App