

Question: Using Table 123 , draw the CPM chart for the project. In this case, make all identifications on the arrows (activities) rather than the events.
Using Table 12–3, draw the CPM chart for the project. In this case, make all identifications on the arrows (activities) rather than the events. Show that the critical path is twenty one weeks.
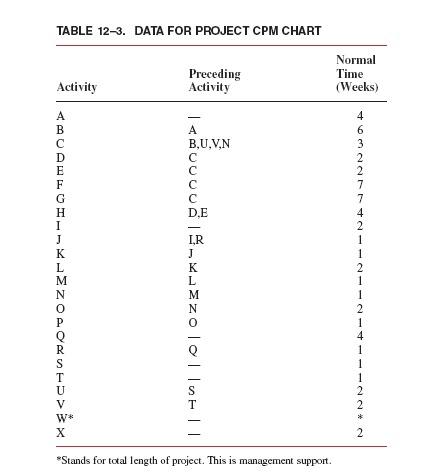
TABLE 12-3. DATA FOR PROJECT CPM CHART Normal Preceding Activity Time Activity (Weeks) 4 A 6. B,U,V.N 3 D 7 G 7 D.E 4 J IR. J 1 1 L M K L 2 M N 2 1 4 1 1 1 U S V T W* X 2 *Stands for total length of project. This is management support. 22*0 NNOPORST ABCAEFCHIIK
Step by Step Solution
3.37 Rating (166 Votes )
There are 3 Steps involved in it
AOA Activity on Arrow Diagram Critical path is QRJKLMNCG or Q... View full answer

Get step-by-step solutions from verified subject matter experts