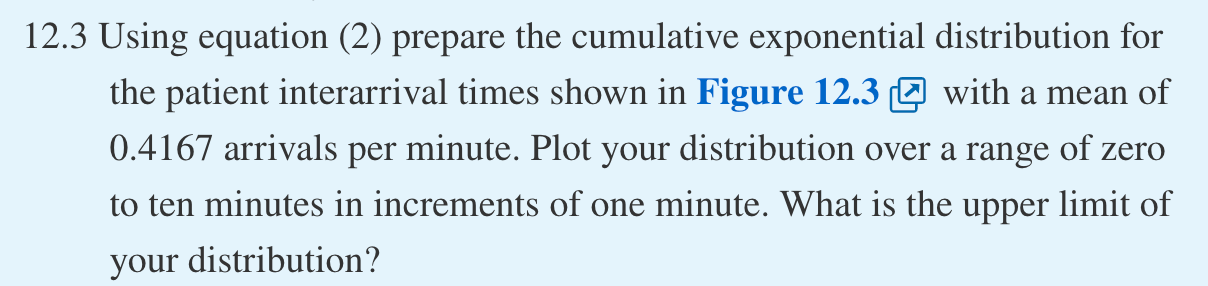
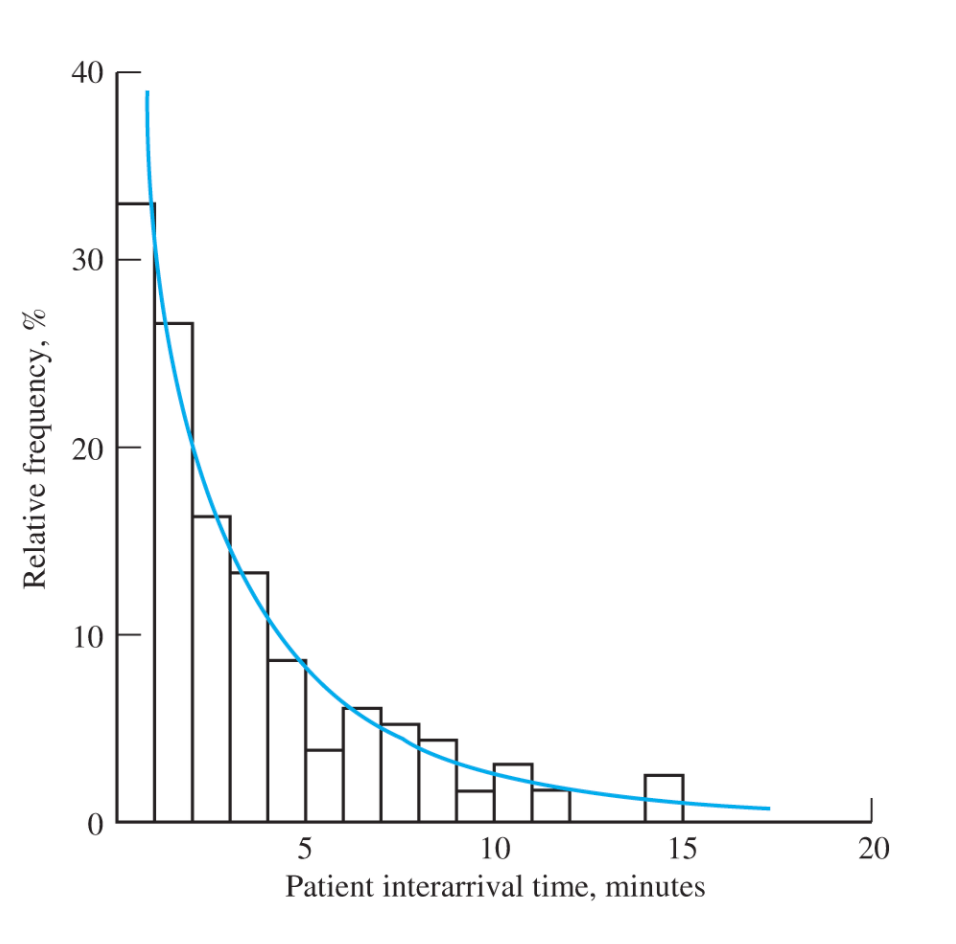
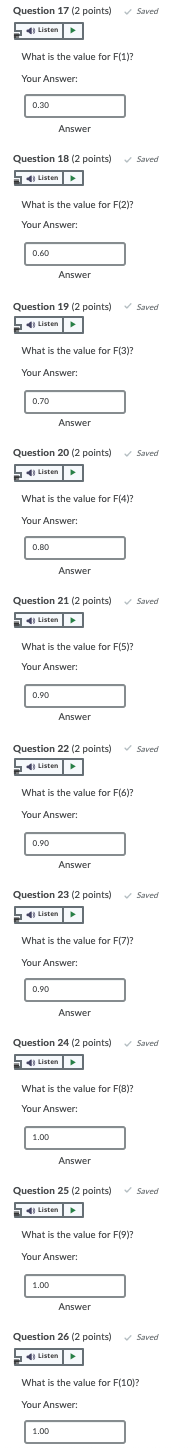
Question: 12.3 Using equation (2) prepare the cumulative exponential distribution for the patient interarrival times shown in Figure 12.3 @ with a mean of 0.4167 arrivals

12.3 Using equation (2) prepare the cumulative12.3 Using equation (2) prepare the cumulative12.3 Using equation (2) prepare the cumulative

12.3 Using equation (2) prepare the cumulative exponential distribution for the patient interarrival times shown in Figure 12.3 @ with a mean of 0.4167 arrivals per minute. Plot your distribution over a range of zero to ten minutes in increments of one minute. What is the upper limit of your distribution? 40 30 Relative frequency, % 20 10 0 20 5 10 15 Patient interarrival time, minutes Question 17 (2 points) Saved Listen What is the value for F(1)? F1 Your Answer: : 0.30 Answer Question 18 (2 points) Saved ) Listen What is the value for F(2)? Your Answer: 0.60 Answer Question 19 (2 points) Saved (2 5 Listen What is the value for F(3)? (3? Your Answer: 0.70 Answer Question 20 (2 points) Saved ) Listen What is the value for F(4)? F4? Your Answer: : 0.80 Answer Saved Question 21 (2 points) 1 Listen What is the value for F(5)? Your Answer: 0.90 Answer Question 22 (2 points) Saved 5 Listen What is the value for F(6)? Your Answer: 0.90 Answer Question 23 (2 points) Saved 5 Listen What is the value for F(7)? ) Your Answer: 0.90 Answer Question 24 (2 points) Saved Listen What is the value for F(8)? Your Answer: : 1.00 Answer Question 25 (2 points) Saved Listen What is the value for F(9)? ? Your Answer: 1.00 Answer Question 26 (2 points) Saved Listen What is the value for F(10)? ( Your Answer: 1.00

Step by Step Solution

There are 3 Steps involved in it

1 Expert Approved Answer
Step: 1 Unlock blur-text-image
Question Has Been Solved by an Expert!

Get step-by-step solutions from verified subject matter experts

Step: 2 Unlock
Step: 3 Unlock

Students Have Also Explored These Related General Management Questions!