

Question: 12.37 The following table shows the frequency distribution for the number of spam e-mails I've received over the last 75 days: Number of Spam E-Mails
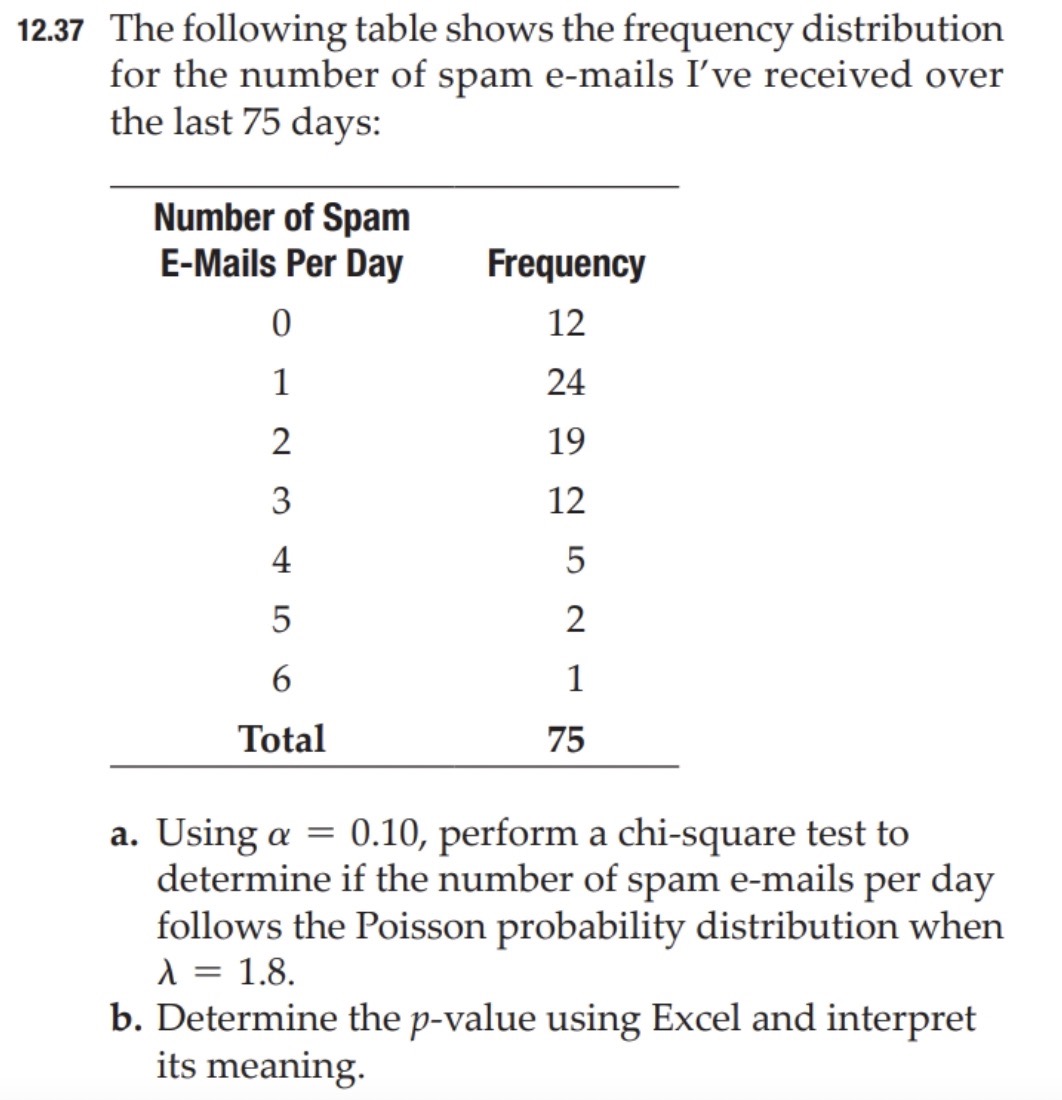

12.37 The following table shows the frequency distribution for the number of spam e-mails I've received over the last 75 days: Number of Spam E-Mails Per Day Frequency 0 12 1 24 2 19 3 12 4 5 5 2 6 1 Total 75 :1. Using a = 0.10, perform a chi-square test to determine if the number of spam emails per day follows the Poisson probability distribution when )1 = 1.8. b. Determine the pvalue using Excel and interpret its meaning
Step by Step Solution
There are 3 Steps involved in it
1 Expert Approved Answer
Step: 1 Unlock

Question Has Been Solved by an Expert!
Get step-by-step solutions from verified subject matter experts
Step: 2 Unlock
Step: 3 Unlock