

Question: The following table shows the frequency distribution for the number of spam emails Ive received over the last 75 days: a. Using = 0.10,
The following table shows the frequency distribution for the number of spam emails I’ve received over the last 75 days:
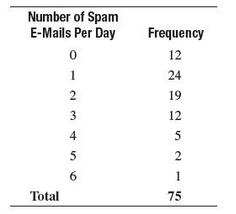
a. Using α = 0.10, perform a chisquare test to determine if the number of spam emails per day follows the Poisson probability distribution when λ = 1.8.
b. Determine the pvalue using Excel and interpret its meaning.
Number of Spam E-Mails Per Day Frequency 12 24 19 12 Total 75
Step by Step Solution
3.35 Rating (161 Votes )
There are 3 Steps involved in it
a H 0 The number spam emails per day follows the Poisson distribution with18 H 1 The ... View full answer

Get step-by-step solutions from verified subject matter experts
Document Format (1 attachment)
483-M-S-C-S-T (262).docx
120 KBs Word File