

Question: 13 14 Data Table 1 Time (s) Note: Because the object in this example, the battery-powered cor, moves with a Displacement (m) constant speed, all
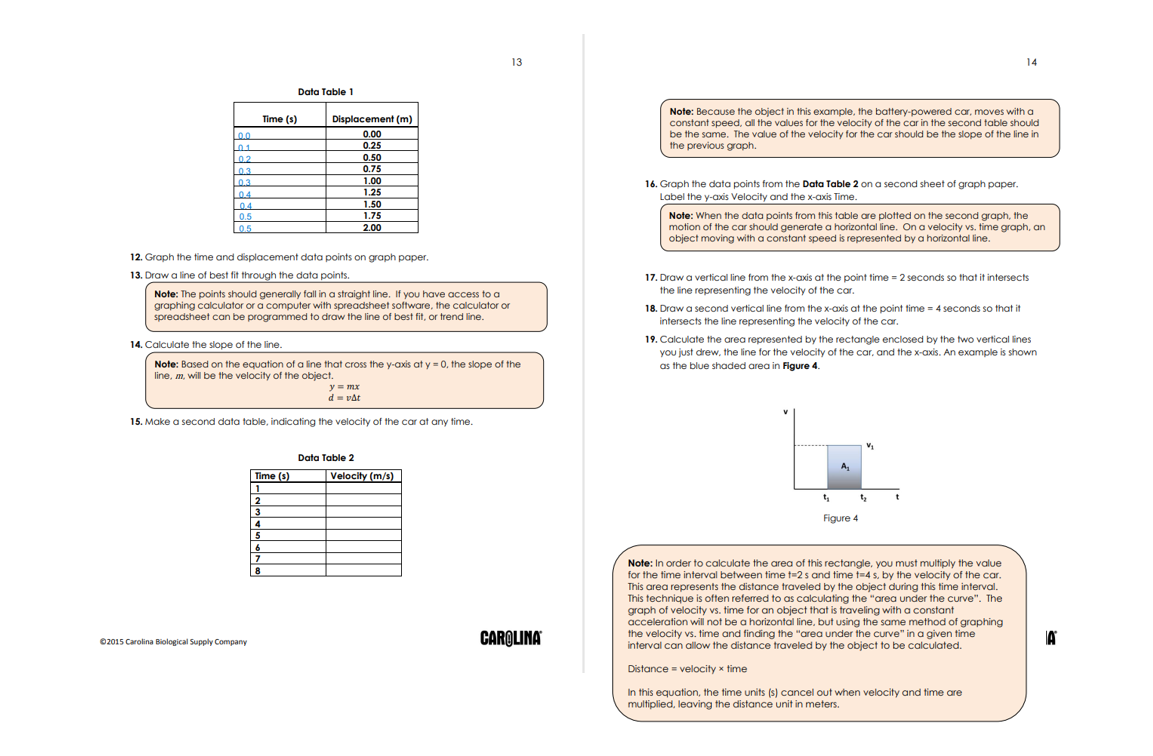
13 14 Data Table 1 Time (s) Note: Because the object in this example, the battery-powered cor, moves with a Displacement (m) constant speed, all the values for the velocity of the car in the second table should 0.0 0,00 be the same. The value of the velocity for the car should be the slope of the line in 01 0.25 the previous graph. 02 0.50 0.3 0.75 0.3 1.00 16. Graph the data points from the Data Table 2 on a second sheet of graph paper. 04 1.25 1.50 Label the y-axis Velocity and the x-axis Time. 1.75 Note: When the data points from this table are plotted on the second graph, the 0.5 2.00 motion of the car should generate a horizontal line. On a velocity vs. time graph, an object moving with a constant speed is represented by a horizontal line. 12. Graph the time and displacement data points on graph paper. 13. Draw a line of best fit through the data points. 17. Draw a vertical line from the x-axis at the point time = 2 seconds so that it intersects Note: The points should generally fall in a straight line. If you have access to a the line representing the velocity of the car. graphing calculator or a computer with spreadsheet software. the calculator or 18. Draw a second vertical line from the x-axis at the point time = 4 seconds so that it spreadsheet can be programmed to draw the line of best fit, or trend line. intersects the line representing the velocity of the car. 14. Calculate the slope of the line. 19. Calculate the area represented by the rectangle enclosed by the two vertical lines you just drew, the line for the velocity of the car, and the x-axis. An example is shown Note: Based on the equation of a line that cross the y-axis at y = 0, the slope of the as the blue shaded area in Figure 4. line, m, will be the velocity of the object. y = mx d = vat 15. Make a second data table, indicating the velocity of the car at any time. Data Table 2 Time (5) Velocity (m/s) 1 Figure 4 Note: In order to calculate the area of this rectangle, you must multiply the value for the time interval between time t=2 s and time t=4 s. by the velocity of the car. This area represents the distance traveled by the object during this time interval. This technique is often referred to as calculating the "area under the curve". The graph of velocity vs. time for an object that is traveling with a constant acceleration will not be a horizontal line. but using the same method of graphing 02015 Carolina Biological Supply Company CAROLINA the velocity vs. time and finding the "area under the curve" in a given time interval can allow the distance traveled by the object to be calculated. IA Distance = velocity x time In this equation, the time units (s) cancel out when velocity and time are multiplied, leaving the distance unit in meters
Step by Step Solution
There are 3 Steps involved in it

Get step-by-step solutions from verified subject matter experts