

Question: 13) Based on the illustrated figure, write a Matlab program to plot the figure. r=0 to 2pi functions are 1) sin(x), 2) cos(x) 3) sin(x)-cos(x)
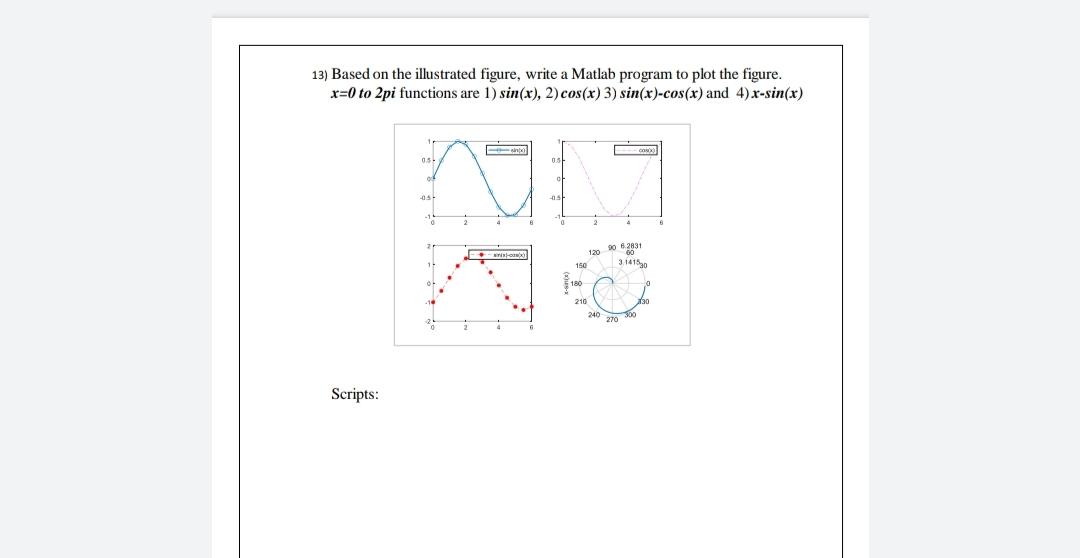
13) Based on the illustrated figure, write a Matlab program to plot the figure. r=0 to 2pi functions are 1) sin(x), 2) cos(x) 3) sin(x)-cos(x) and 4).x-sin(x) 03 03 -14 120 150 90 6.2001 314150 130 210 240 270 Scripts
Step by Step Solution
There are 3 Steps involved in it
1 Expert Approved Answer
Step: 1 Unlock

Question Has Been Solved by an Expert!
Get step-by-step solutions from verified subject matter experts
Step: 2 Unlock
Step: 3 Unlock