

Question: 13 E6-29. Analyzing Inventory with Data Visualization Consider the following inventory graphics for Walmart and Target, two large US retailers who com- pete head to
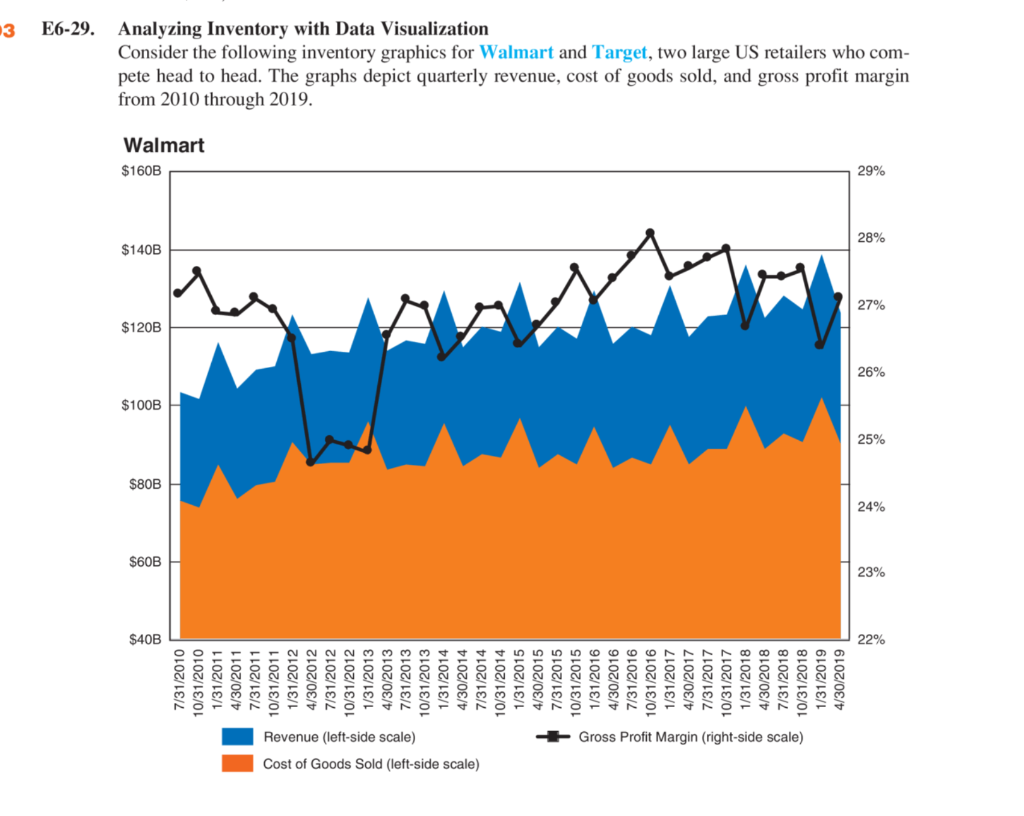
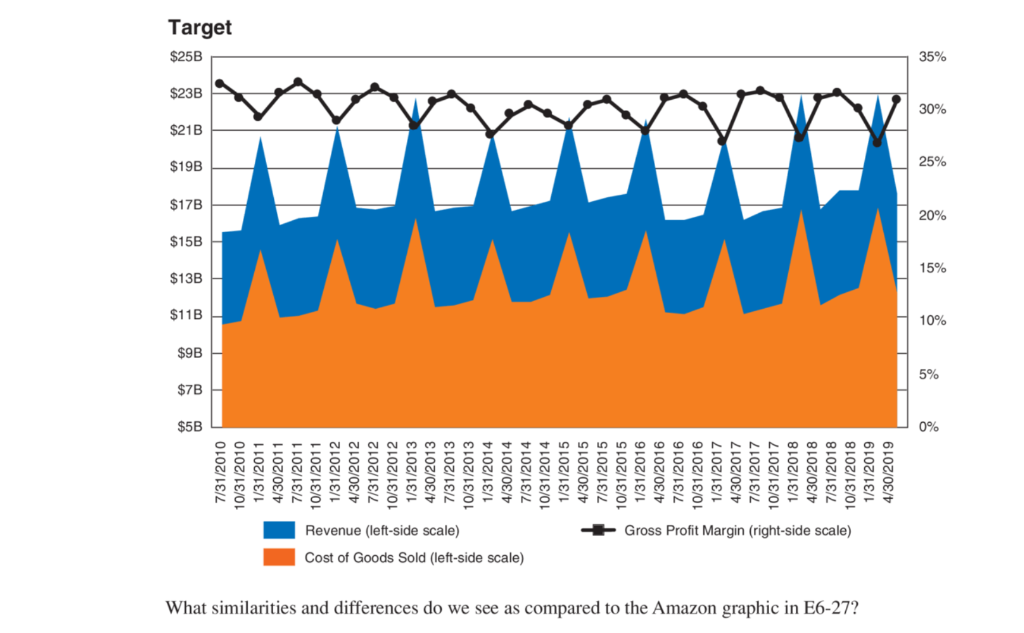
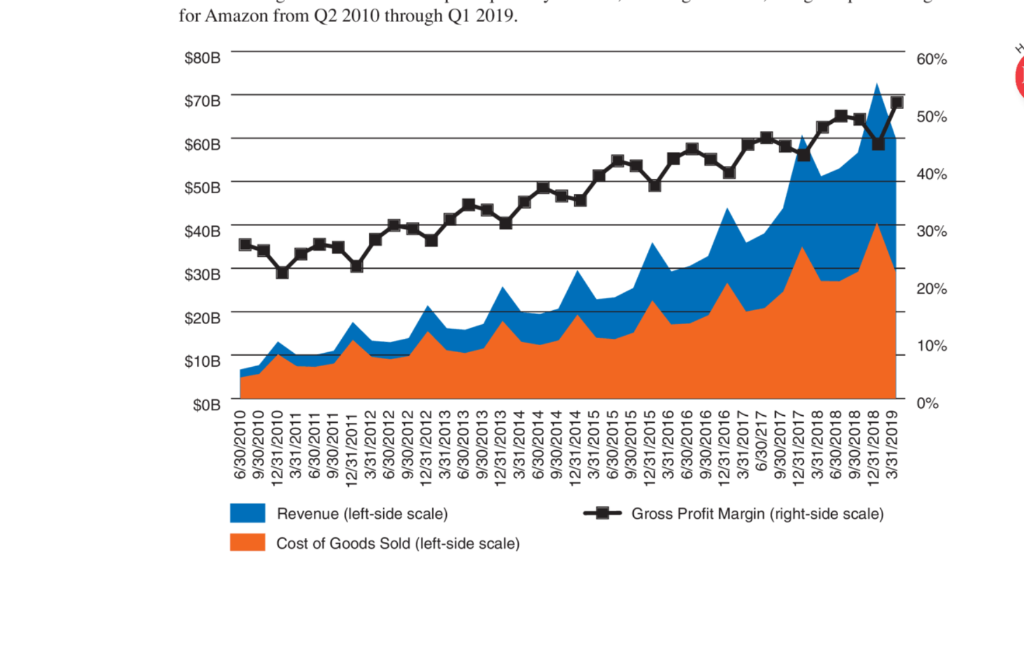
13 E6-29. Analyzing Inventory with Data Visualization Consider the following inventory graphics for Walmart and Target, two large US retailers who com- pete head to head. The graphs depict quarterly revenue, cost of goods sold, and gross profit margin from 2010 through 2019. Walmart $160B 29% 28% $140B 27% $120B 26% $100B 25% $80B 24% $60B 23% $40B 22% 7/31/2010 10/31/2010 1/31/2011 4/30/2011 7/31/2011 10/31/2011 1/31/2012 4/30/2012 7/31/2012 10/31/2012 1/31/2013 4/30/2013 7/31/2013 10/31/2013 1/31/2014 4/30/2014 7/31/2014 10/31/2014 1/31/2015 4/30/2015 7/31/2015 10/31/2015 1/31/2016 4/30/2016 7/31/2016 10/31/2016 wird 1/31/2017 4/30/2017 7/31/2017 10/31/2017 1/31/2018 4/30/2018 7/31/2018 10/31/2018 1/31/2019 4/30/2019 Gross Profit Margin (right-side scale) Revenue (left side scale) Cost of Goods Sold (left-side scale) 35% 20% 15% 10% 5% 7/31/2010 10/31/2010 1/31/2011 4/30/2011 7/31/2011 10/31/2011 1/31/2012 4/30/2012 7/31/2012 10/31/2012 1/31/2013 4/30/2013 7/31/2013 10/31/2013 1/31/2014 4/30/2014 7/31/2014 10/31/2014 1/31/2015 4/30/2015 7/31/2015 10/31/2015 1/31/2016 4/30/2016 7/31/2016 10/31/2016 1/31/2017 4/30/2017 7/31/2017 10/31/2017 1/31/2018 4/30/2018 7/31/2018 10/31/2018 1/31/2019 4/30/2019 Gross Profit Margin (right-side scale) Revenue (left-side scale) Cost of Goods Sold (left-side scale) What similarities and differences do we see as compared to the Amazon graphic in E6-27? for Amazon from Q2 2010 through Q1 2019. $80B %09 $70B $60B $50B $40B $30B 6/30/2010 9/30/2010 12/31/2010 3/31/2011 6/30/2011 9/30/2011 12/31/2011 3/31/2012 6/30/2012 9/30/2012 12/31/2012 3/31/2013 6/30/2013 9/30/2013 12/31/2013 3/31/2014 6/30/2014 9/30/2014 12/31/2014 3/31/2015 6/30/2015 9/30/2015 12/31/2015 3/31/2016 6/30/2016 9/30/2016 12/31/2016 3/31/2017 6/30/217 9/30/2017 12/31/2017 3/31/2018 6/30/2018 9/30/2018 12/31/2018 3/31/2019 + Gross Profit Margin (right-side scale) Revenue (left-side scale) Cost of Goods Sold (left-side scale) 13 E6-29. Analyzing Inventory with Data Visualization Consider the following inventory graphics for Walmart and Target, two large US retailers who com- pete head to head. The graphs depict quarterly revenue, cost of goods sold, and gross profit margin from 2010 through 2019. Walmart $160B 29% 28% $140B 27% $120B 26% $100B 25% $80B 24% $60B 23% $40B 22% 7/31/2010 10/31/2010 1/31/2011 4/30/2011 7/31/2011 10/31/2011 1/31/2012 4/30/2012 7/31/2012 10/31/2012 1/31/2013 4/30/2013 7/31/2013 10/31/2013 1/31/2014 4/30/2014 7/31/2014 10/31/2014 1/31/2015 4/30/2015 7/31/2015 10/31/2015 1/31/2016 4/30/2016 7/31/2016 10/31/2016 wird 1/31/2017 4/30/2017 7/31/2017 10/31/2017 1/31/2018 4/30/2018 7/31/2018 10/31/2018 1/31/2019 4/30/2019 Gross Profit Margin (right-side scale) Revenue (left side scale) Cost of Goods Sold (left-side scale) 35% 20% 15% 10% 5% 7/31/2010 10/31/2010 1/31/2011 4/30/2011 7/31/2011 10/31/2011 1/31/2012 4/30/2012 7/31/2012 10/31/2012 1/31/2013 4/30/2013 7/31/2013 10/31/2013 1/31/2014 4/30/2014 7/31/2014 10/31/2014 1/31/2015 4/30/2015 7/31/2015 10/31/2015 1/31/2016 4/30/2016 7/31/2016 10/31/2016 1/31/2017 4/30/2017 7/31/2017 10/31/2017 1/31/2018 4/30/2018 7/31/2018 10/31/2018 1/31/2019 4/30/2019 Gross Profit Margin (right-side scale) Revenue (left-side scale) Cost of Goods Sold (left-side scale) What similarities and differences do we see as compared to the Amazon graphic in E6-27? for Amazon from Q2 2010 through Q1 2019. $80B %09 $70B $60B $50B $40B $30B 6/30/2010 9/30/2010 12/31/2010 3/31/2011 6/30/2011 9/30/2011 12/31/2011 3/31/2012 6/30/2012 9/30/2012 12/31/2012 3/31/2013 6/30/2013 9/30/2013 12/31/2013 3/31/2014 6/30/2014 9/30/2014 12/31/2014 3/31/2015 6/30/2015 9/30/2015 12/31/2015 3/31/2016 6/30/2016 9/30/2016 12/31/2016 3/31/2017 6/30/217 9/30/2017 12/31/2017 3/31/2018 6/30/2018 9/30/2018 12/31/2018 3/31/2019 + Gross Profit Margin (right-side scale) Revenue (left-side scale) Cost of Goods Sold (left-side scale)
Step by Step Solution
There are 3 Steps involved in it

Get step-by-step solutions from verified subject matter experts