

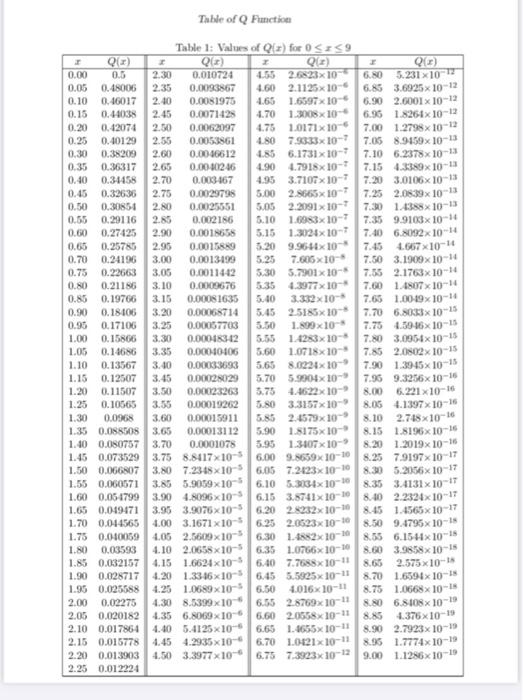
13) Find the mean, variance and skew of the random variable X whose density function is:...
Fantastic news! We've Found the answer you've been seeking!
Question:
Transcribed Image Text:
13) Find the mean, variance and skew of the random variable X whose density function is: Q(z) 0.5 0.80 0.85 Table of Q Function Table 1: Values of Q(z) for 0≤x≤9 Q(z) H Q(G) 5.231x10 6.80 2.1125x10⁻⁶ Q(z) 0.010724 4.55 2.6823x10 0.0093867 4.60 0.0081975 4.65 1.6597x10- 0.0071428 4.70 0.0062097 4.75 6.85 3.6925x10⁻¹² 6.90 2.6001x10⁻¹² 1.3008x10⁻⁶ 6.96 1.8264x10⁻¹² 1.0171x10 7.9333x10⁻⁷ 4.85 6.1731x10⁻⁷ 4.90 4.7918x 10⁻⁷ 7.00 1.2798x10⁻¹² 0.0053861 4.80 7.05 8.9459x10⁻¹³ 0.0046612 7.10 6.2378x10⁻¹³ 0.0040246 7.15 4.3389x10⁻¹³ 0.003467 4.95 3.7107x10⁻⁷ 7.20 3.0106x10⁻¹³ 0.0029798 5.00 2.8665x10⁻⁷ 7.25 2.0839x10⁻¹³ 0.0025551 5.05 2.2091x10⁻⁷ 7.30 1.4388x10⁻¹³ 0.002186 5.10 1.6083x10⁻⁷ 7.35 9.9103x10⁻¹⁴ 0.0018658 5.15 1.3024x10⁻⁷ 7.40 6.8092x10⁻¹⁴ 0.0015889 5.20 9.9644x10 7.45 4.667x10⁻¹⁴ 0.0013499 5.25 7.605×10- 7.50 3.1909x10⁻¹⁴ 0.0011442 5.30 5.7901x10⁻⁵ 7.55 2.1763x10⁻¹⁴ 0.0009676 5.35 4.3977x10-* 7.60 1.4807x10⁻¹⁴ 0.00081635 5.40 3.332x10- 7.65 1.0049x10⁻¹⁴ 0.00068714 5.45 2.5185x10⁸ 7.70 6.8033x 10⁻¹⁵ 7.75 4.5946x10⁻¹⁵ 0.00057703 5.50 1.899x10 0.00048342 5.55 1.4283x10⁸ 7.80 3.0054x10⁻¹⁵ F 0.00 2.30 0.05 0.48006 2.35 0.10 0.46017 2.40 0.15 0.44038 2.45 0.20 0.42074 2.50 0.25 0.40129 2.55 0.30 0.38209 2.60 0.35 0.36317 2.65 0.40 0.34458 2.70 0.45 0.32636 2.75 0.50 0.30854 2.80 0.55 0.29116 2.85 0.60 0.27425 2.90 0.65 0.25785 2.95 0.70 0.24196 3.00 0.75 0.22663 3.05 0.21186 3.10 0.19766 3.15 0.90 0.18406 3.20 0.95 0.17106 3.25 1.00 0.15866 3.30 0.14686 3.35 0.00040406 5.60 1.0718x10 7.85 2.0802x 10⁻¹⁵ 1.05 1.10 8.00 0.13567 3.40 0.00033693 5.65 8.0224×10⁹ 7.90 1.3945x 10⁻¹⁵ 1.15 0.12507 3.45 0.00028029 5.70 5.9904x10⁹ 7.96 9.3256x10⁻¹⁶ 1.20 0.11507 3.50 0.00023263 5.75 4.4622x10- 6.221x10⁻¹⁶ 1.25 0.10565 3.55 0.00019262 5.80 3.3157×10⁹ 8.05 4.1397x10⁻¹⁶ 1.30 0.0968 3.60 0.00015911 5.85 2.4579x10 8.10 2.748x10⁻¹⁶ 1.35 0.088508 3.65 0.00013112 5.90 1.8175x10 8.15 1.8196x10⁻¹⁶ 1.40 0.080757 3.70 0.0001078 5.95 1.3407x10⁻⁹ 8.20 1.2019x10⁻¹⁶ 1.45 0.073529 3.75 8.8417x10- 6.00 9.8659x10⁻¹⁰ 8.25 7.9197x10⁻¹⁷ 1.50 0.066807 3.80 7.2348x10⁻⁵ 6.05 7.2423x10⁻¹⁰ 8.30 5.2056x 10⁻¹⁷ 1.55 0.060571 3.85 5.9059x10⁵ 6.10 5.3034x10⁻¹⁰ 8.35 3.4131x10⁻¹⁷ 1.60 0.054799 3.90 4.8096x10⁻⁵ 6.15 3.8741x10⁻¹⁰ 8.40 2.2324x10⁻¹⁷ 1.65 0.049471 3.95 3.9076x10⁻⁵ 6.20 2.8232x10⁻¹⁰ 8.45 1.4565x10⁻¹⁷ 1.70 0.044565 4.00 3.1671x10 6.25 2.0523x10⁻¹⁰ 8.50 9.4795x10⁻¹⁸ 1.75 0.040059 4.05 2.5609x10- 6.30 14882x10-10 8.55 6.1544x10⁻¹⁸ 1.80 0.03593 4.10 2.0658x10⁻⁵ 6.35 1.0766x10⁻¹⁰ 8.60 3.9858x10⁻¹⁸ 1.85 0.032157 4.15 1.6624x10⁻⁵ 6.40 7.7688x10⁻¹¹ 8.65 2.575x10⁻¹⁸ 1.90 0.028717 4.20 1.3346x10 6.45 5.5925x10⁻¹¹ 8.70 1.6594x 10⁻¹⁸ 1.95 0.025588 4.25 1.0689x10⁵ 6.50 4.016x10⁻¹¹ 8.75 1.0668x10⁻¹⁸ 2.00 0.02275 4.30 8.5399x10 6.55 2.8769x10⁻¹¹ 8.80 6.8408x10⁻¹⁹ 2.05 0.020182 4.35 6.8069x10⁻⁶ 6.60 2.0558x10⁻¹¹ 8.85 4.376x10⁻¹⁹ 2.10 0.017864 4.40 5.4125x10 6.65 1.4655x10⁻¹¹ 8.90 2.7923x10⁻¹⁹ 2.15 0.015778 4.45 4.2935x10 6.70 1.0421x10⁻¹¹ 8.95 1.7774x10⁻¹⁹ 2.20 0.013903 4.50 3.3977x10 6.75 7.3923x10⁻¹² 9.00 1.1286x10⁻¹⁹ 2.25 0.012224 13) Find the mean, variance and skew of the random variable X whose density function is: Q(z) 0.5 0.80 0.85 Table of Q Function Table 1: Values of Q(z) for 0≤x≤9 Q(z) H Q(G) 5.231x10 6.80 2.1125x10⁻⁶ Q(z) 0.010724 4.55 2.6823x10 0.0093867 4.60 0.0081975 4.65 1.6597x10- 0.0071428 4.70 0.0062097 4.75 6.85 3.6925x10⁻¹² 6.90 2.6001x10⁻¹² 1.3008x10⁻⁶ 6.96 1.8264x10⁻¹² 1.0171x10 7.9333x10⁻⁷ 4.85 6.1731x10⁻⁷ 4.90 4.7918x 10⁻⁷ 7.00 1.2798x10⁻¹² 0.0053861 4.80 7.05 8.9459x10⁻¹³ 0.0046612 7.10 6.2378x10⁻¹³ 0.0040246 7.15 4.3389x10⁻¹³ 0.003467 4.95 3.7107x10⁻⁷ 7.20 3.0106x10⁻¹³ 0.0029798 5.00 2.8665x10⁻⁷ 7.25 2.0839x10⁻¹³ 0.0025551 5.05 2.2091x10⁻⁷ 7.30 1.4388x10⁻¹³ 0.002186 5.10 1.6083x10⁻⁷ 7.35 9.9103x10⁻¹⁴ 0.0018658 5.15 1.3024x10⁻⁷ 7.40 6.8092x10⁻¹⁴ 0.0015889 5.20 9.9644x10 7.45 4.667x10⁻¹⁴ 0.0013499 5.25 7.605×10- 7.50 3.1909x10⁻¹⁴ 0.0011442 5.30 5.7901x10⁻⁵ 7.55 2.1763x10⁻¹⁴ 0.0009676 5.35 4.3977x10-* 7.60 1.4807x10⁻¹⁴ 0.00081635 5.40 3.332x10- 7.65 1.0049x10⁻¹⁴ 0.00068714 5.45 2.5185x10⁸ 7.70 6.8033x 10⁻¹⁵ 7.75 4.5946x10⁻¹⁵ 0.00057703 5.50 1.899x10 0.00048342 5.55 1.4283x10⁸ 7.80 3.0054x10⁻¹⁵ F 0.00 2.30 0.05 0.48006 2.35 0.10 0.46017 2.40 0.15 0.44038 2.45 0.20 0.42074 2.50 0.25 0.40129 2.55 0.30 0.38209 2.60 0.35 0.36317 2.65 0.40 0.34458 2.70 0.45 0.32636 2.75 0.50 0.30854 2.80 0.55 0.29116 2.85 0.60 0.27425 2.90 0.65 0.25785 2.95 0.70 0.24196 3.00 0.75 0.22663 3.05 0.21186 3.10 0.19766 3.15 0.90 0.18406 3.20 0.95 0.17106 3.25 1.00 0.15866 3.30 0.14686 3.35 0.00040406 5.60 1.0718x10 7.85 2.0802x 10⁻¹⁵ 1.05 1.10 8.00 0.13567 3.40 0.00033693 5.65 8.0224×10⁹ 7.90 1.3945x 10⁻¹⁵ 1.15 0.12507 3.45 0.00028029 5.70 5.9904x10⁹ 7.96 9.3256x10⁻¹⁶ 1.20 0.11507 3.50 0.00023263 5.75 4.4622x10- 6.221x10⁻¹⁶ 1.25 0.10565 3.55 0.00019262 5.80 3.3157×10⁹ 8.05 4.1397x10⁻¹⁶ 1.30 0.0968 3.60 0.00015911 5.85 2.4579x10 8.10 2.748x10⁻¹⁶ 1.35 0.088508 3.65 0.00013112 5.90 1.8175x10 8.15 1.8196x10⁻¹⁶ 1.40 0.080757 3.70 0.0001078 5.95 1.3407x10⁻⁹ 8.20 1.2019x10⁻¹⁶ 1.45 0.073529 3.75 8.8417x10- 6.00 9.8659x10⁻¹⁰ 8.25 7.9197x10⁻¹⁷ 1.50 0.066807 3.80 7.2348x10⁻⁵ 6.05 7.2423x10⁻¹⁰ 8.30 5.2056x 10⁻¹⁷ 1.55 0.060571 3.85 5.9059x10⁵ 6.10 5.3034x10⁻¹⁰ 8.35 3.4131x10⁻¹⁷ 1.60 0.054799 3.90 4.8096x10⁻⁵ 6.15 3.8741x10⁻¹⁰ 8.40 2.2324x10⁻¹⁷ 1.65 0.049471 3.95 3.9076x10⁻⁵ 6.20 2.8232x10⁻¹⁰ 8.45 1.4565x10⁻¹⁷ 1.70 0.044565 4.00 3.1671x10 6.25 2.0523x10⁻¹⁰ 8.50 9.4795x10⁻¹⁸ 1.75 0.040059 4.05 2.5609x10- 6.30 14882x10-10 8.55 6.1544x10⁻¹⁸ 1.80 0.03593 4.10 2.0658x10⁻⁵ 6.35 1.0766x10⁻¹⁰ 8.60 3.9858x10⁻¹⁸ 1.85 0.032157 4.15 1.6624x10⁻⁵ 6.40 7.7688x10⁻¹¹ 8.65 2.575x10⁻¹⁸ 1.90 0.028717 4.20 1.3346x10 6.45 5.5925x10⁻¹¹ 8.70 1.6594x 10⁻¹⁸ 1.95 0.025588 4.25 1.0689x10⁵ 6.50 4.016x10⁻¹¹ 8.75 1.0668x10⁻¹⁸ 2.00 0.02275 4.30 8.5399x10 6.55 2.8769x10⁻¹¹ 8.80 6.8408x10⁻¹⁹ 2.05 0.020182 4.35 6.8069x10⁻⁶ 6.60 2.0558x10⁻¹¹ 8.85 4.376x10⁻¹⁹ 2.10 0.017864 4.40 5.4125x10 6.65 1.4655x10⁻¹¹ 8.90 2.7923x10⁻¹⁹ 2.15 0.015778 4.45 4.2935x10 6.70 1.0421x10⁻¹¹ 8.95 1.7774x10⁻¹⁹ 2.20 0.013903 4.50 3.3977x10 6.75 7.3923x10⁻¹² 9.00 1.1286x10⁻¹⁹ 2.25 0.012224
Expert Answer:

Related Book For 

Posted Date:
Students also viewed these electrical engineering questions
-
Find the expected value of the random variable X whose probability density is given by for 0
-
The p.d.f. of a random variable X is f (x) = 2x for 0 x 1. Suppose that measurements are very imprecise, and that all values of X 0.5 are recorded as 0.25 and all values of X > 0.5 are recorded as...
-
The p.d.f. of a random variable X is f(x) = 2x for 0 x 1. Suppose that measurements are imprecise, and that all values of X 0.25 are recorded as 0.25, all values of 0.25 < X 0.5 are recorded as...
-
Amie, Inc., has 100,000 shares of $2 par value stock outstanding. Prairie Corporation acquired 30,000 of Amie's shares on January 1, 2015, for $120,000 when Amie's net assets had a total fair value...
-
A manufacturing firm produces two products. Each product must go through an assembly process and a finishing process. The product is then transferred to the warehouse, which has space for only a...
-
Dowell Company produces a single product. Its income statements under absorption costing for its first two years of operation follow. Additional Information a. Sales and production data for these...
-
What is meant by the term fact pleading?
-
Using Return Distributions suppose the returns on long-term corporate bonds are normally distributed. Based on the historical record, what is the approximate probability that your return on these...
-
Eta Designs, Inc. has the following data: (Click the icon to view the data.) Perform a vertical analysis of Eta Designs' balance sheet for each year. Begin by performing a vertical analysis of Eta...
-
Based on the information provided in the case, illustrate the pricing game between Sony and Microsoft using a 2-by-2 payoff matrix when Sony and Microsoft charge for their games $399, or lower price...
-
a) Calculate under linear elastic conditions the angle of twist at mid-span, axial stresses at positions 1 to 7 for a cross-section located at mid-span and shear stresses at 1 to 7 for a...
-
What makes a form of communication nonverbal? Why do we sometimes call nonverbal communication body language?
-
What is meant by the term post-trust era?
-
What is the difference between an explicit rule and an implicit rule? What are examples of explicit and implicit communication rules that you might encounter, or have encountered, in the professional...
-
How is a words denotative meaning different from its connotative meaning?
-
What do networkers do to make their communication successful? How can you adopt the same strategies to improve your own communication?
-
A resource is considered valuable if it can be utilized to exploit an external opportunity or neutralize a potential threat. A resource is considered rare when there are few competitors in the...
-
TRUE-FALSE QUESTIONS 1. In terms of preliminary analytical procedures, assume that the company has introduced a new product with a low price point and significant customer demand. The auditor would...
-
Let X and Y have joint density for real x, y. (a) Identify the distribution of X and Y and parameters. (b) Identify the conditional distribution of X given Y = y. (c) Use R to find P(X >1|Y = 0.5)...
-
Show that if a transition matrix for a Markov chain is symmetric, that is, if T ij = T ji for all i and j, then the Markov chain is time-reversible.
-
Use R to simulate the probability in Exercise 1.30 Data from Exercise 1.30: A tetrahedron dice is four-sided and labeled with 1, 2, 3, and 4. When rolled it lands on the base of a pyramid and the...
-
Find the flexibility and stiffness influence coefficients of the system shown in Fig. 6.29. Also, derive the equations of motion of the system. k1 k3 k4 000 /711 000 m2 000 my 000 FIGURE 6.29...
-
Find the flexibility and stiffness influence coefficients of the torsional system shown in Fig. 6.28. Also write the equations of motion of the system. (GJ)1 01 Compressor (GJ)2 (Jan) Turbine (142)...
-
Derive the stiffness matrix of the system shown in Fig. 5.39. mo e(t) ellee k1 k2 lllll m x(t) FIGURE 5.39 Mass hanging from a pulley.

Study smarter with the SolutionInn App