

Question: 13. The following is an incomplete ANOVA source table summarizing the results of a study of the variance of reaction times during a training exercise
13. The following is an incomplete ANOVA source table summarizing the results of a study of the variance of reaction times during a training exercise in a sample of 14 highly experienced, 14 moderately experienced, and 14 inexperienced athletes.
Source of Variation | SS | df | MS | F |
Between groups | ||||
Within groups | 50 | |||
Total | 80 |
a. complete the source table
b. compute eta-squared (n2).
c. Is the decision to reject the H0 or to fail to reject H0?
14. A total of 104 families (adolescents, mothers, and fathers) participated in a study on race/ethnicity and self-esteem. Participants completed a profile that conceptualized self-esteem as perceived competence in multiple domains. To analyze the data, a series of ANOVAs were conducted. Refer to the table below:
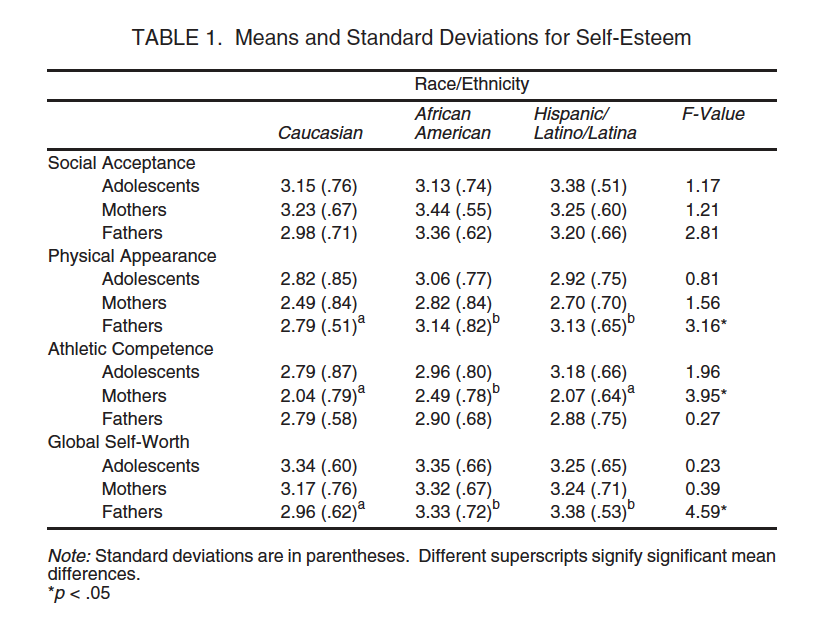
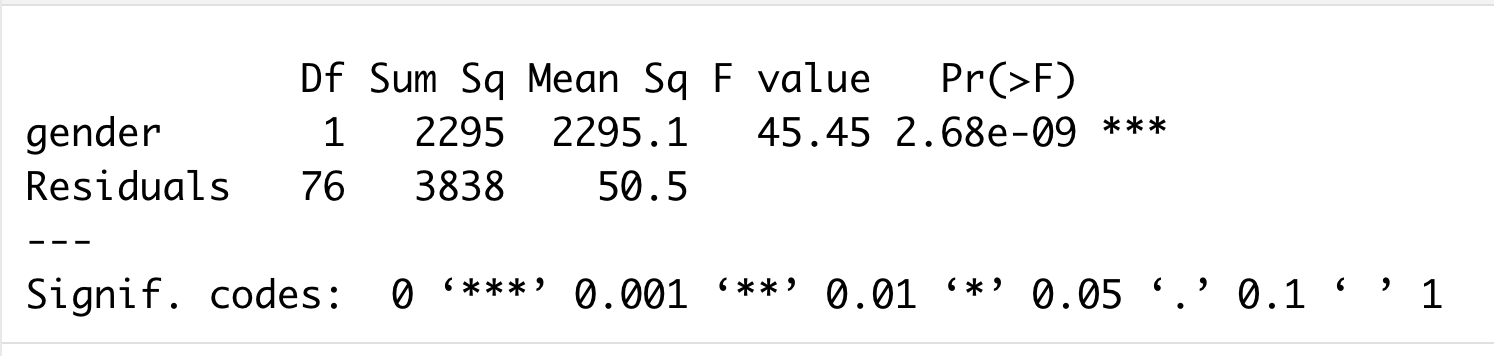
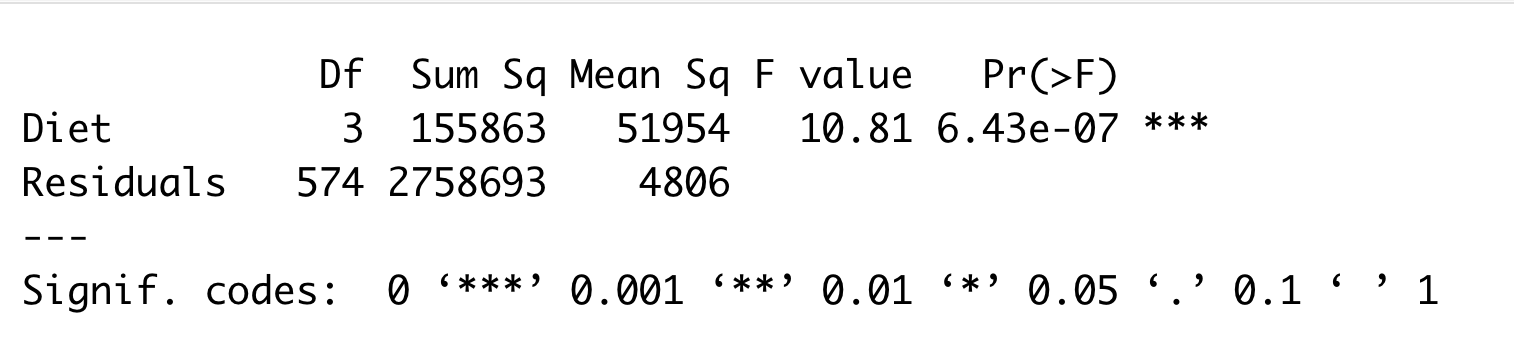
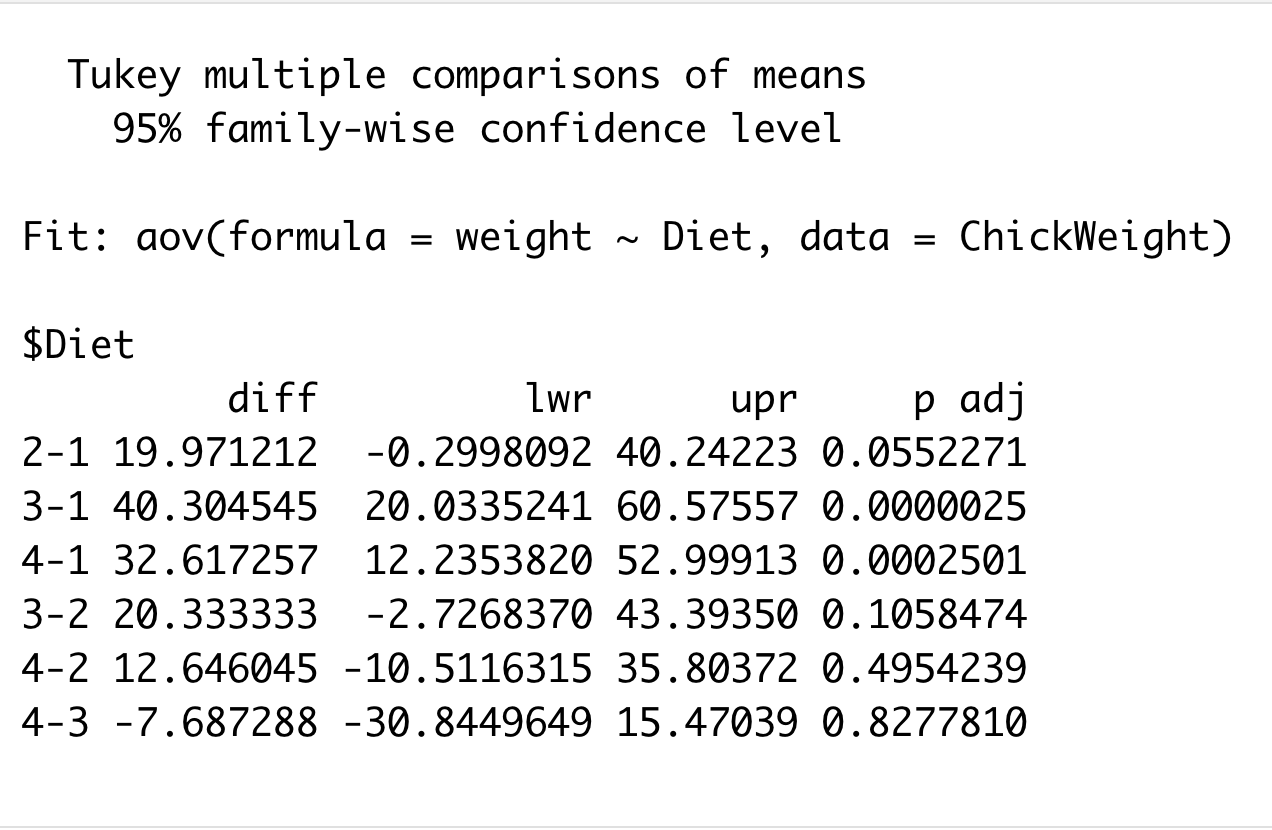
TABLE 1. Means and Standard Deviations for Self-Esteem Race/Ethnicity African Hispanic/ F-Value Caucasian American Latino/Latina Social Acceptance Adolescents 3.15 (.76) 3.13 (.74) 3.38 (.51) 1.17 Mothers 3.23 (.67) 3.44 (.55) 3.25 (.60) 1.21 Fathers 2.98 (.71) 3.36 (.62) 3.20 (.66) 2.81 Physical Appearance Adolescents 2.82 (.85) 3.06 (.77) 2.92 (.75) 0.81 Mothers 2.49 (.84) 2.82 (.84) 2.70 (.70) 1.56 Fathers 2.79 (.51) 3.14 (.82) 3.13 (.65) 3.16* Athletic Competence Adolescents 2.79 (.87) 2.96 (.80) 3.18 (.66) 1.96 Mothers 2.04 (.79) 2.49 (.78) 2.07 (.64)a 3.95* Fathers 2.79 (.58) 2.90 (.68) 2.88 (.75) 0.27 Global Self-Worth Adolescents 3.34 (.60) 3.35 (.66) 3.25 (.65) 0.23 Mothers 3.17 (.76) 3.32 (.67) 3.24 (.71) 0.39 Fathers 2.96 (.62) 3.33 (.72) 3.38 (.53) 4.59* Note: Standard deviations are in parentheses. Different superscripts signify significant mean differences. *p <.05 sum sq mean f value pr> F) gender 1 2295 2295.1 45 . 45 2. 68e-09 *** Residuals 76 3838 50.5 Signif. codes: 0 ' * * *' 0. 001 ' * *' 0. 01 '*' 0. 05 '. ' 0.1 ' ' 1Df Sum Sq Mean Sq F value Pr(>F) Diet 3 155863 51954 10.81 6. 43e-07 *** Residuals 574 2758693 4806 Signif. codes: D ' * * * ' 0 001 ' * *' 0. 01 '*' 0. 05 '. ' 0. 1 ' ' 1\f
Step by Step Solution
There are 3 Steps involved in it

Get step-by-step solutions from verified subject matter experts