

Question: 133 CHAPTER 3 Financial Statements and Ratio Analysis Common-size statement analysis A common-size income statement for Creek Enterprises' 2018 operations follows. Using the firm's 2019
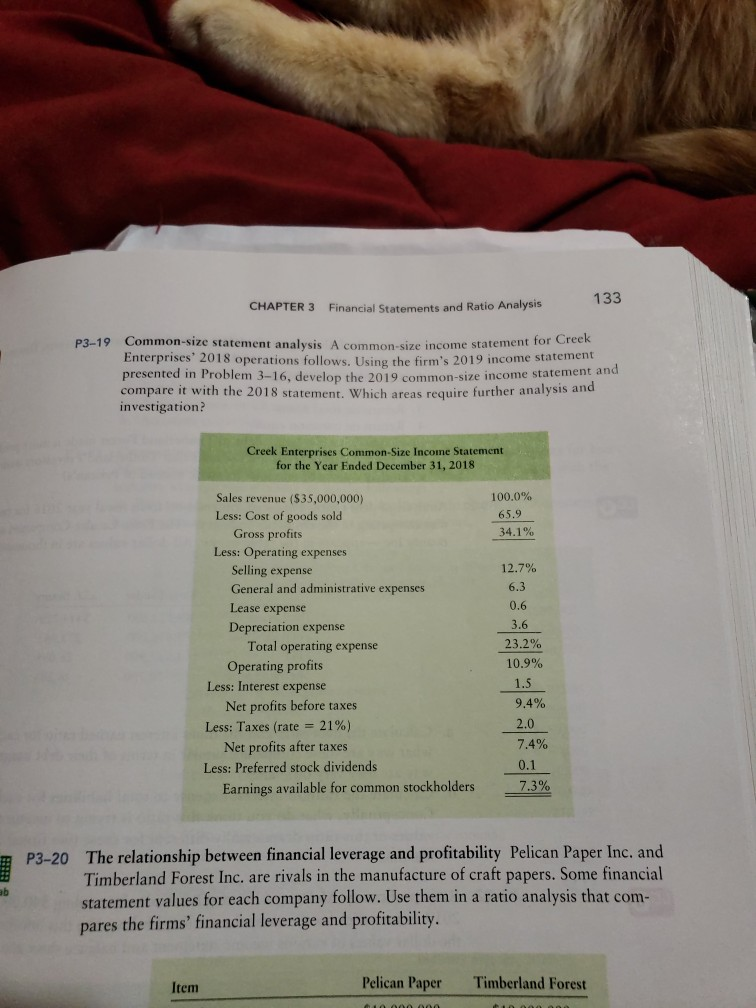
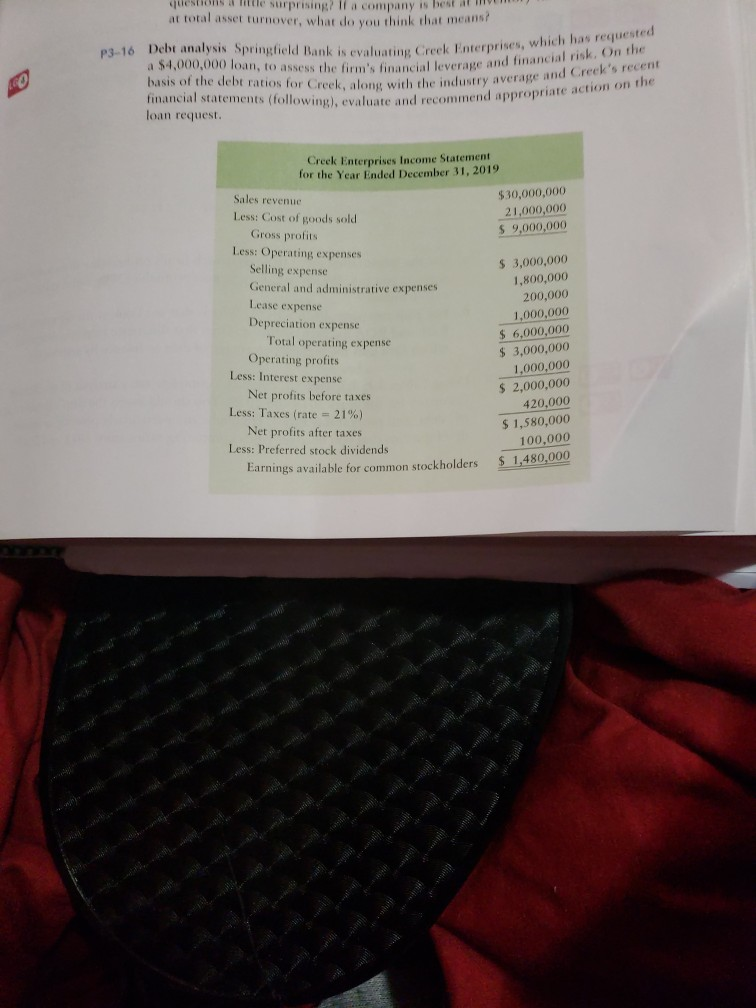
133 CHAPTER 3 Financial Statements and Ratio Analysis Common-size statement analysis A common-size income statement for Creek Enterprises' 2018 operations follows. Using the firm's 2019 income statem presented in Problem 3-16, develop the 2019 common-size income statement an compare it with the 2018 statement. Which areas require further analysis and investigation? P3-19 Creek Enterprises Common-Size Income Statement for the Year Ended December 31, 2018 Sales revenue ($35,000,000) Less: Cost of goods sold 100.0% 65.9 34.1% Gross profits Less: Operating expenses Selling expense General and administrative expenses Lease expense Depreciation expense 12.7% 6.3 0.6 Total operating expense Operating profits 23.2% 10.9% Less: Interest expense Less: Taxes (rate-21 %) Less: Preferred stock dividends 1.5 9.4% 2.0 7.4% 0.1 7.3% Net profits before taxes Net profits after taxes Earnings available for common stockholders The relationship between financial leverage and profitability Pelican Paper Inc. and Timberland Forest Inc. are rivals in the manufacture of craft papers. Some financial statement values for each company follow. Use them in a ratio analysis that com- pares the firms' financial leverage and profitability. P3-20 ab Item Pelican Paper Timberland Forest questions te surprising? If a company is best at at total asset turnover, what do you think that is evaluating Creek Enterprises, which has requested d Creek's recent action on the p3-16 Debt analysis Springfield Bank a $4,000,000 loan, to assess basis of the debt ratios for Creek, along with the industry average an financial statements (following), evaluate and recommend appropria loan request the firm's financial leverage and financial risk. On the Creek Enterprises Income Statement for the Year Ended December 31, 2019 Sales revenue 5 30,000,000 21,000,000 $ 9,000,000 Less: Cost of goods sold Gross profits Less: Operating expenses $ 3,000,000 1,800,000 200,000 1,000,000 $ 6,000,000 $ 3,000,000 1,000,000 $ 2,000,000 420,000 $1,580,000 100,000 nrnings available for common stockholders $ 1,480,000 Selling expense General and administrative expenses Lease expense Depreciation expense Total operating expense Less: Interest expense Less: Taxes (rate 21%) Less: Preferred stock dividends Operating profits Net profits before taxes Net profits after taxes
Step by Step Solution
There are 3 Steps involved in it

Get step-by-step solutions from verified subject matter experts