Question: 14. 13. 12. where y = Dependent Variable and x = Independent Variable. 11. Caf Michigan's manager, Gary Stark, suspects that demand for mocha latte
14.
13.
12.
where y = Dependent Variable and x = Independent Variable.
11.
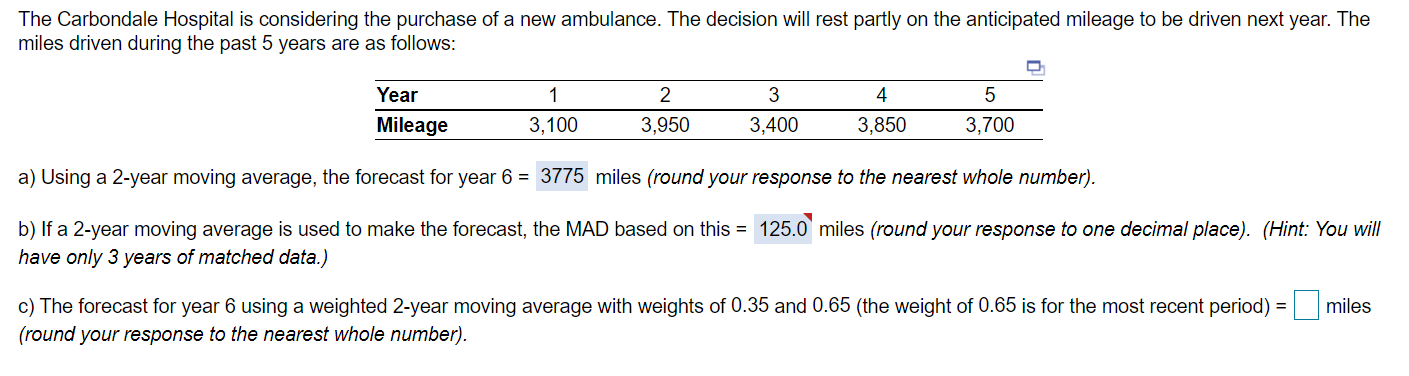
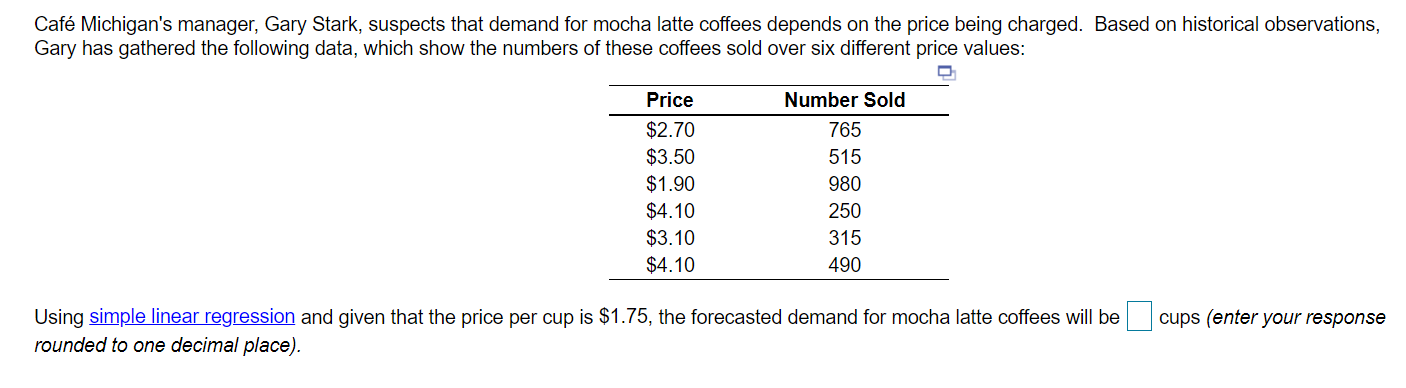
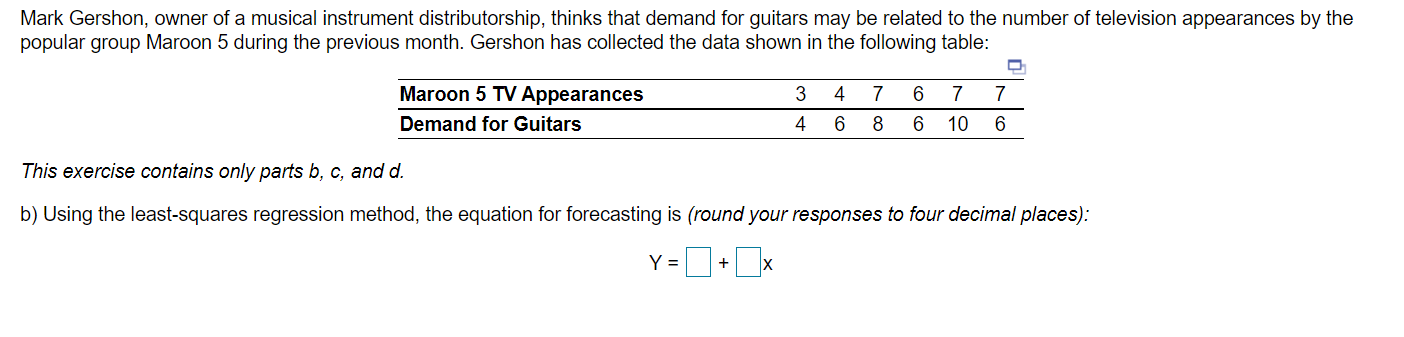
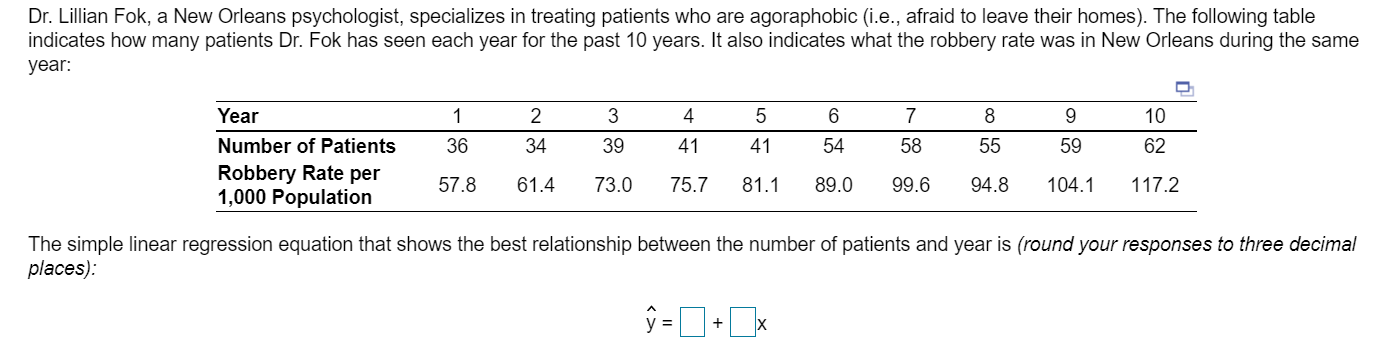
Caf Michigan's manager, Gary Stark, suspects that demand for mocha latte coffees depends on the price being charged. Based on historical observations, Gary has gathered the following data, which show the numbers of these coffees sold over six different price values: Price $2.70 $3.50 $1.90 $4.10 $3.10 $4.10 Number Sold 765 515 980 250 315 490 Using simple linear regression and given that the price per cup is $1.75, the forecasted demand for mocha latte coffees will be rounded to one decimal place). cups (enter your response Mark Gershon, owner of a musical instrument distributorship, thinks that demand for guitars may be related to the number of television appearances by the popular group Maroon 5 during the previous month. Gershon has collected the data shown in the following table: 3 4 7 6 7 Maroon 5 TV Appearances Demand for Guitars 7 6 4 6 8 6 10 This exercise contains only parts b, c, and d. b) Using the least-squares regression method, the equation for forecasting is (round your responses to four decimal places): Y = + x Please copy and paste data from text area below. Selected delimiter: Tab Observation 1 Observation 2 Observation 3 Observation 4 Maroon 5 TV Appearances 3 4 7 6 7 7 Demand for Guitars 4 6 8 6 10 6 obsery Dr. Lillian Fok, a New Orleans psychologist, specializes in treating patients who are agoraphobic (i.e., afraid to leave their homes). The following table indicates how many patients Dr. Fok has seen each year for the past 10 years. It also indicates what the robbery rate was in New Orleans during the same year: 1 2 3 4 5 6 8 9 10 7 58 36 34 39 41 41 54 55 59 62 Year Number of Patients Robbery Rate per 1,000 Population 57.8 61.4 73.0 75.7 81.1 89.0 99.6 94.8 104.1 117.2 The simple linear regression equation that shows the best relationship between the number of patients and year is (round your responses to three decimal places): = + x = + The Carbondale Hospital is considering the purchase of a new ambulance. The decision will rest partly on the anticipated mileage to be driven next year. The miles driven during the past 5 years are as follows: Year 1 2 3 4 5 Mileage 3,100 3.950 3,400 3,850 3,700 a) Using a 2-year moving average, the forecast for year 6 = 3775 miles (round your response to the nearest whole number). b) If a 2-year moving average is used to make the forecast, the MAD based on this = 125.0 miles (round your response to one decimal place). (Hint: You will have only 3 years of matched data.) = C) The forecast for year 6 using a weighted 2-year moving average with weights of 0.35 and 0.65 (the weight of 0.65 is for the most recent period) = miles (round your response to the nearest whole number)


