

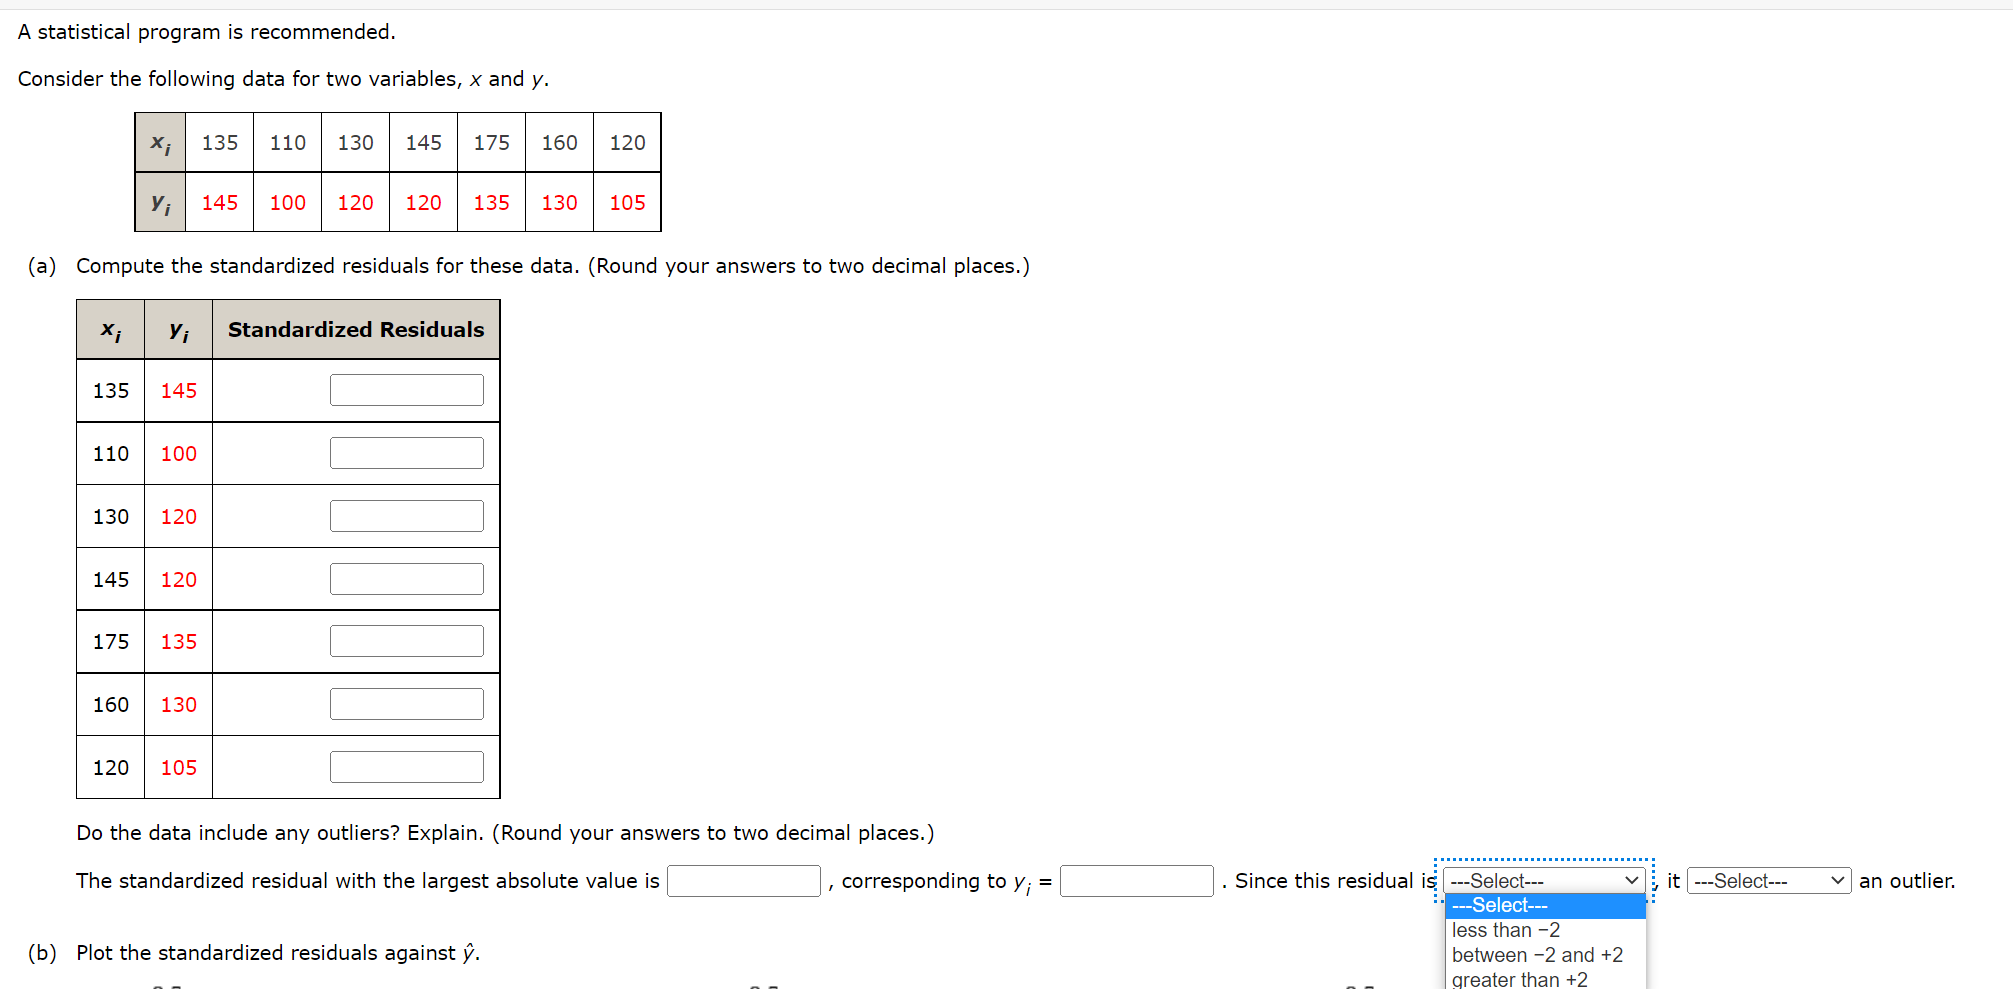
Question: 14. A statistioal program is recommended. Consider the following data for two variables, X and y. (a) Compute the standardized residuals for these data. (Round
14.
![y,- Standardized Residuals 135 145 [::::::::::j 110 100 :] 130 120 :]](https://s3.amazonaws.com/si.experts.images/answers/2024/06/668124a494dde_556668124a481669.jpg)
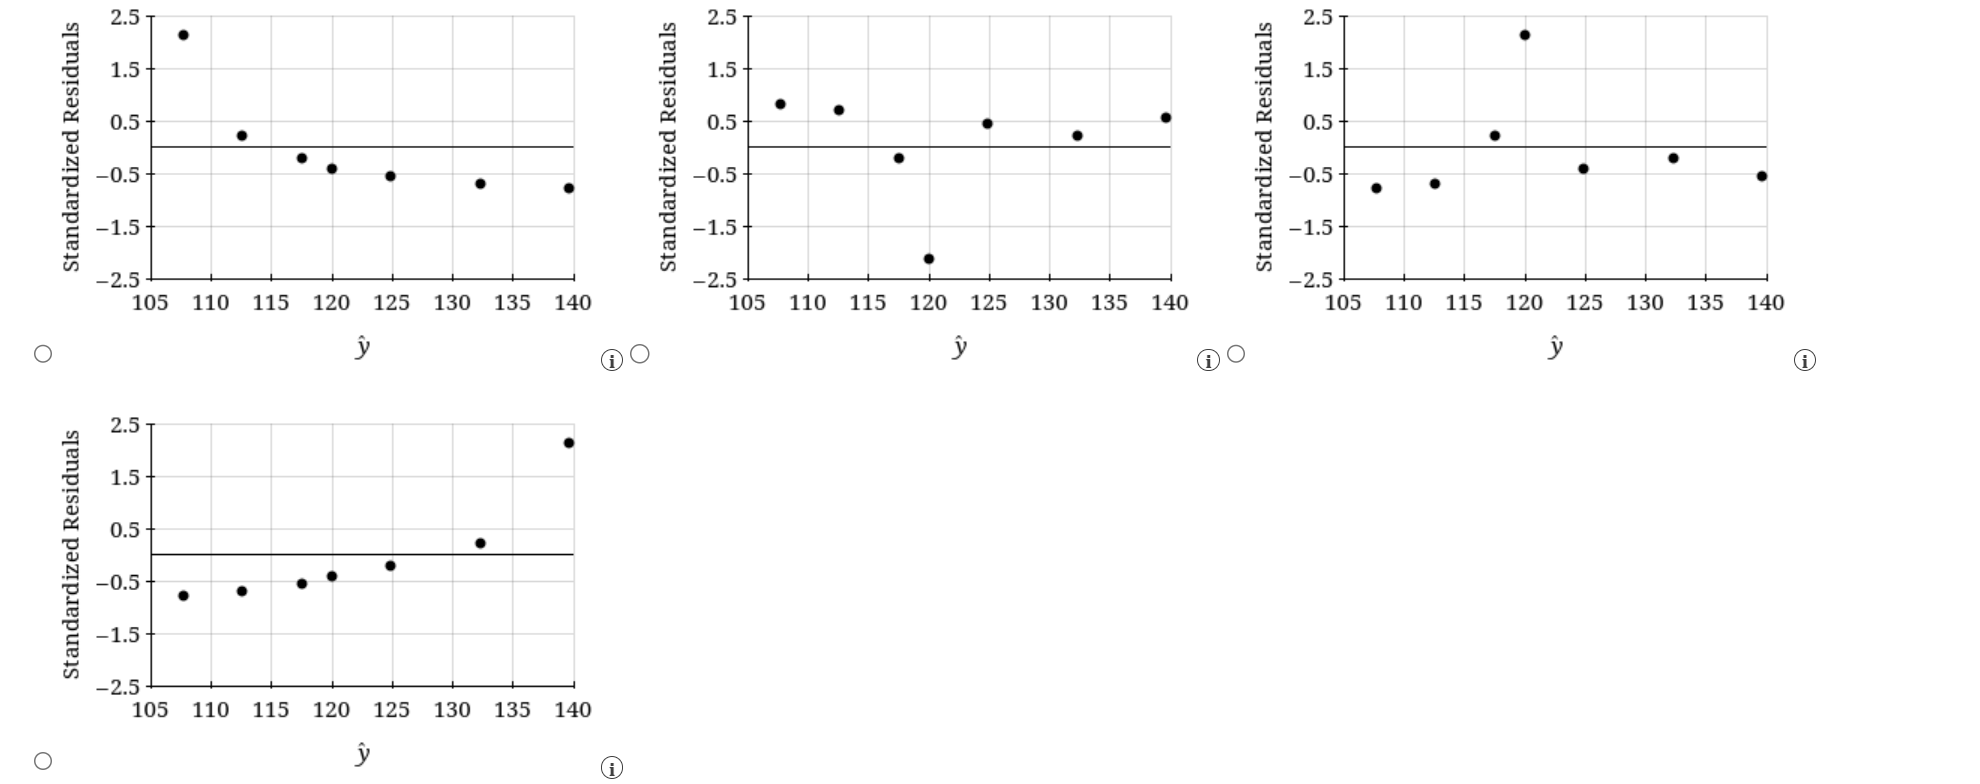
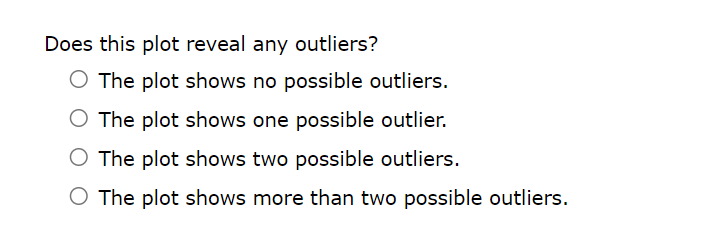
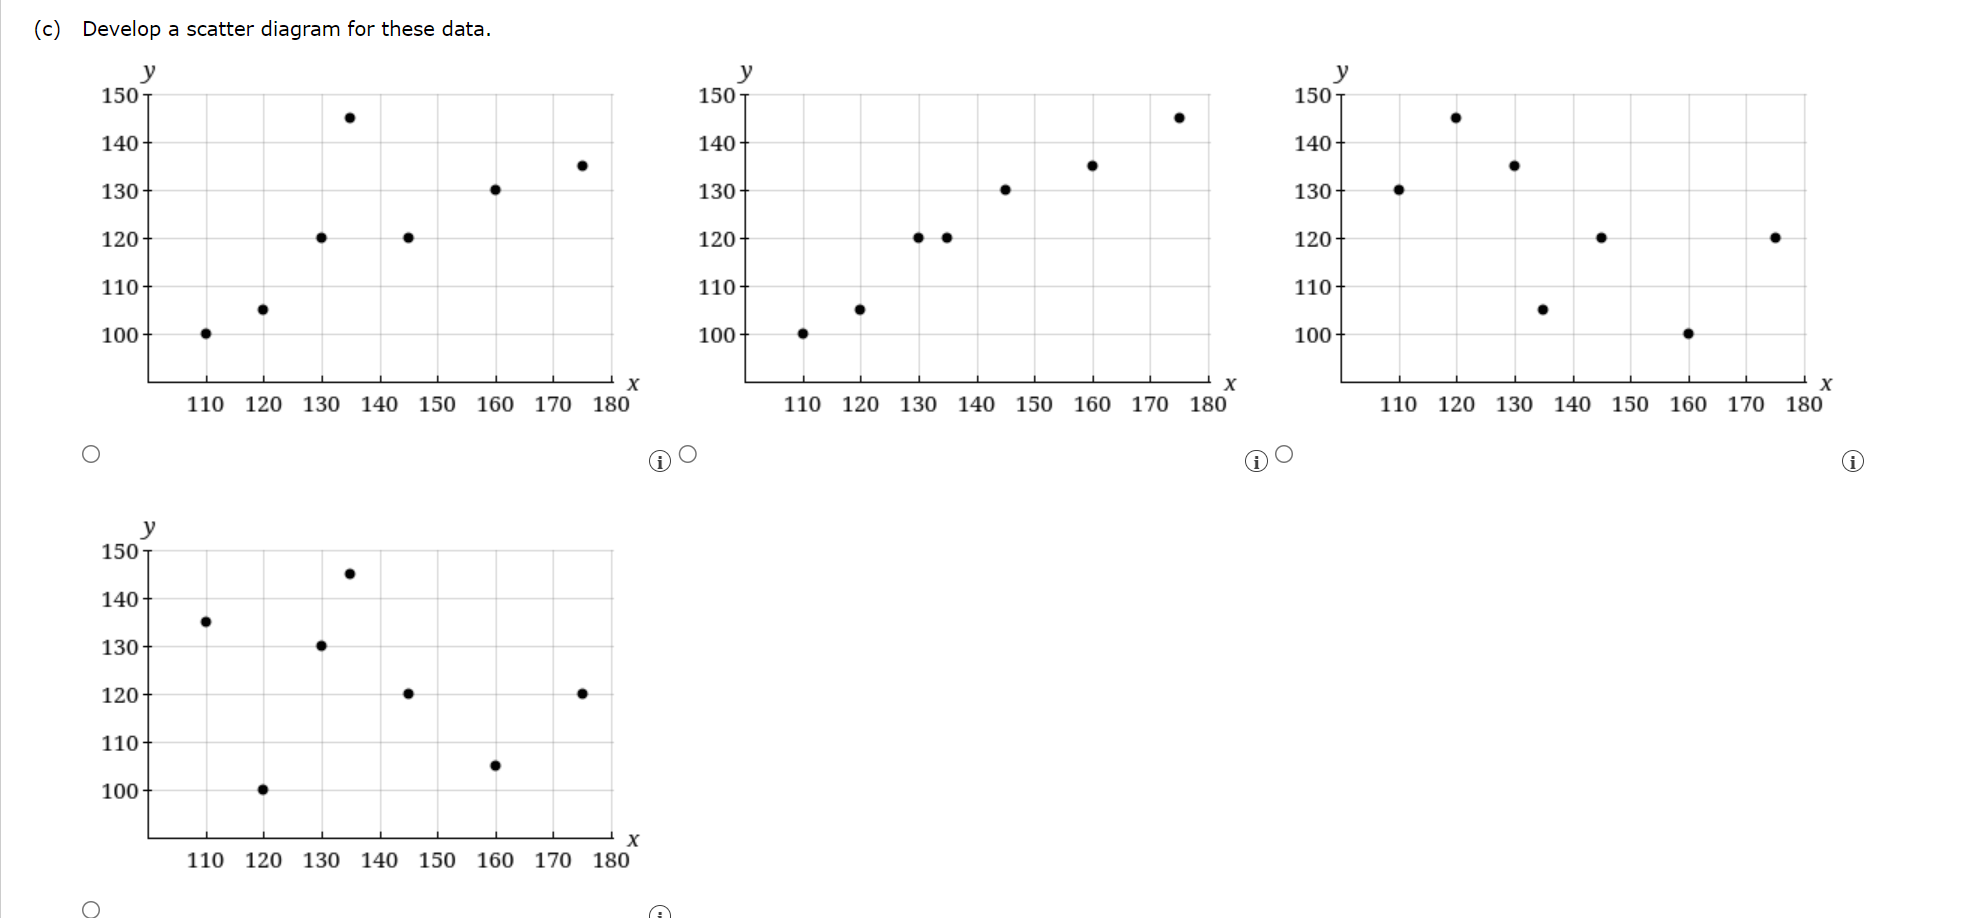
A statistioal program is recommended. Consider the following data for two variables, X and y. (a) Compute the standardized residuals for these data. (Round your answers to two decimal places.) 29 135 110 130 145 175 160 120 y} 145 100 120 120 135 130 105 xi y,- Standardized Residuals 135 145 [::::::::::j 110 100 :] 130 120 :] 145 120 l:] 175 135 l:] 160 130 [::::::::::j 120 105 :] Do the data include any outliers? Explain. (Round your answers to two decimal places.) The standardized residual with the largest absolute value is :] , corresponding to yl- = :] . Since this residual is (b) Plot the standardized residuals against 9. ' ---Selecl-- less than -2 between 2 and +2 Greaterthan +2 it an outlier- 2.5 2.5 2.5 1.5 1.5 1.5 0.5 0.5 0.5 Standardized Residuals Standardized Residuals Standardized Residuals -0.5 -0.5 -0.5 -1.5 -1.5 -1.5 -2.5 -2.5 -2.5 105 110 115 120 125 130 135 140 105 110 115 120 125 130 135 140 105 110 115 120 125 130 135 140 y O V i 2.5 1.5 0.5 Standardized Residuals -0.5 -1.5 -2.5 105 110 115 120 125 130 135 140 ODoes this plot reveal any outliers? O The plot shows no possible outliers. O The plot shows one possible outlier. O The plot shows two possible outliers. O The plot shows more than two possible outliers.\fDoes the scatter diagram indicate any outliers in the data? 0 The diagram indicates that there are no possible outliers. 0 'he diagram indicates that there is one possible outlier. 0 "he diagram indicates that there are two possible outliers. 0 "he diagram indicates that there are more than two possible outliers. In general, what implications does this nding have for simple linear regression? O For simple linear regression, we must calculate standardized residuals, plot a standardized residual plot, and construct a scatter diagram to identify an outlier. O For simple linear regression, we can determine an outlier by looking at the scatter diagram. 0 For simple linear regression, it is impossible to determine whether there is an outlier using standardized residuals, a standardized residual plot, or a scatter diagram
Step by Step Solution
There are 3 Steps involved in it

Get step-by-step solutions from verified subject matter experts