

Question: A statistical program is recommended. Consider the following data for two variables, x and y. (a) Develop an estimated regression equation for the data of
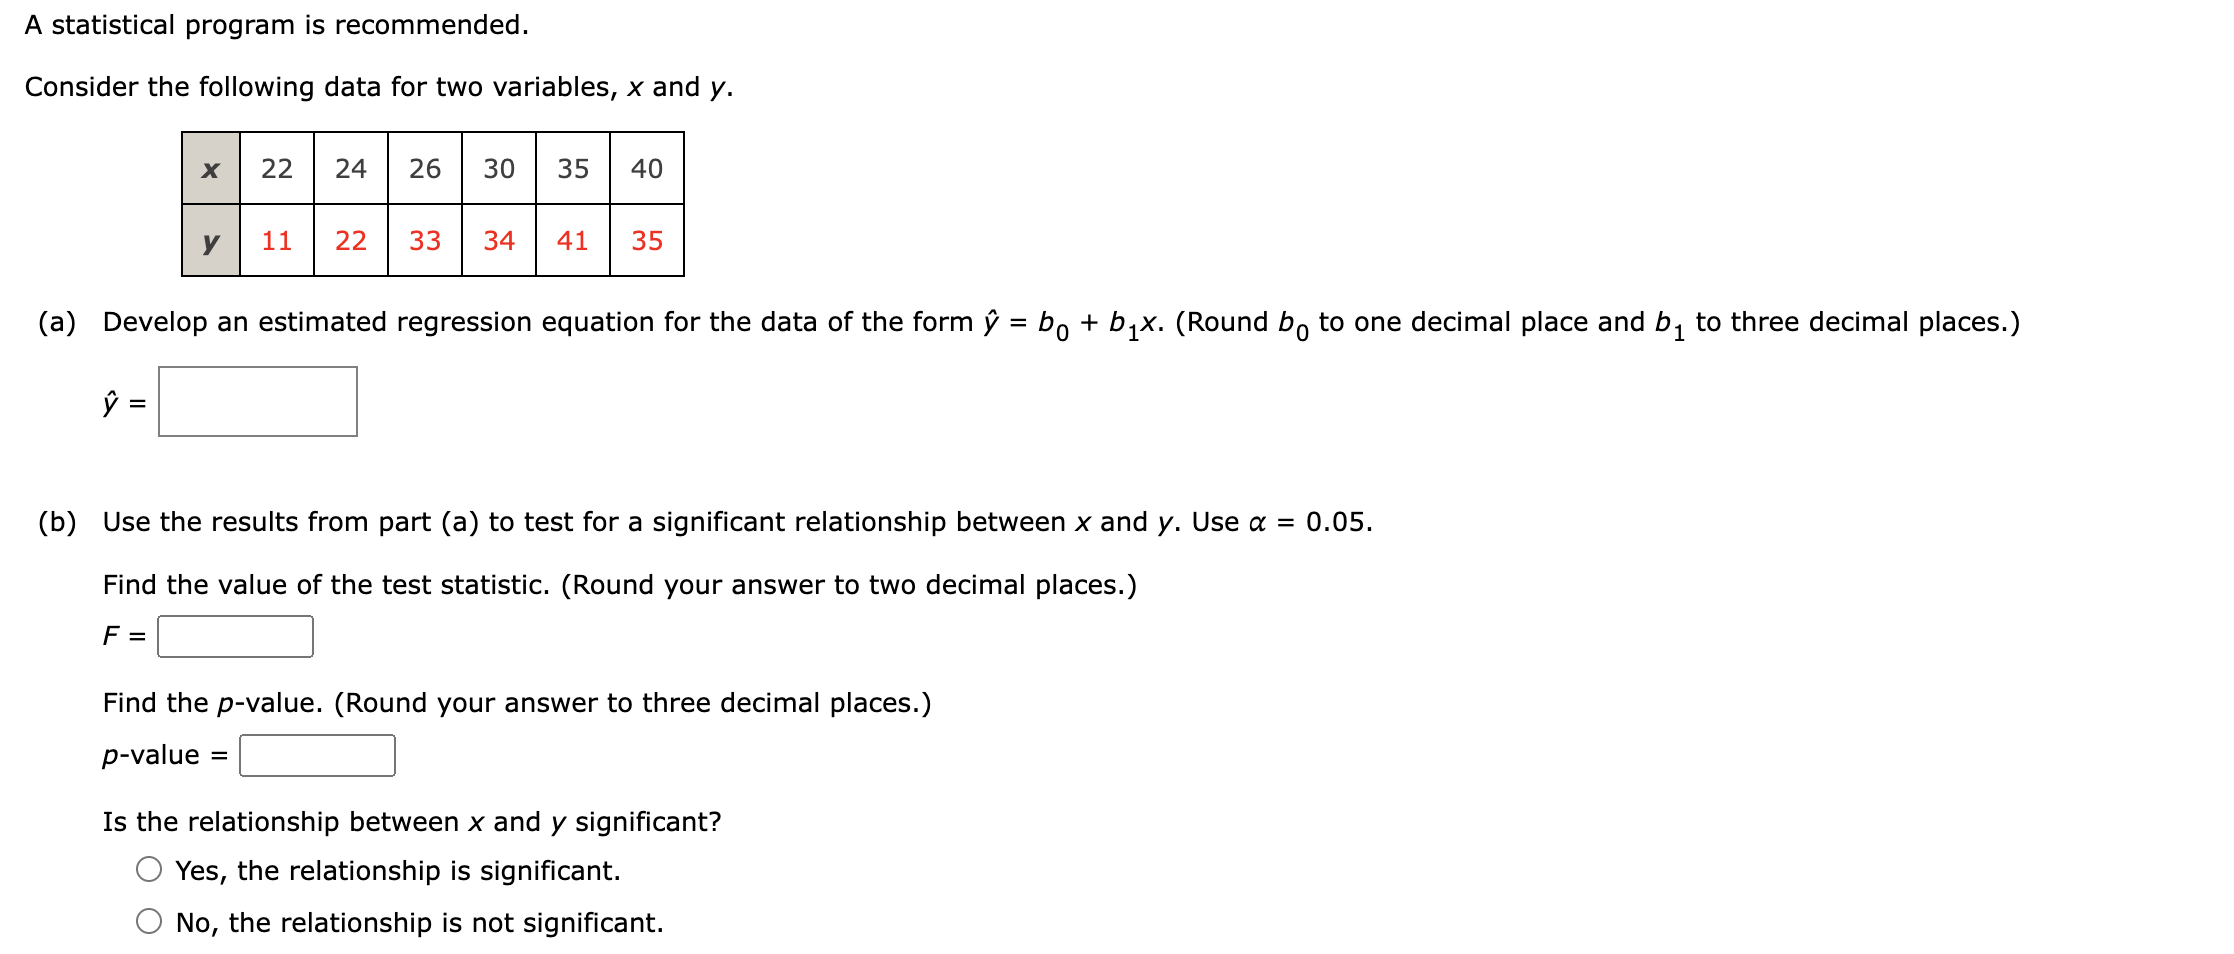
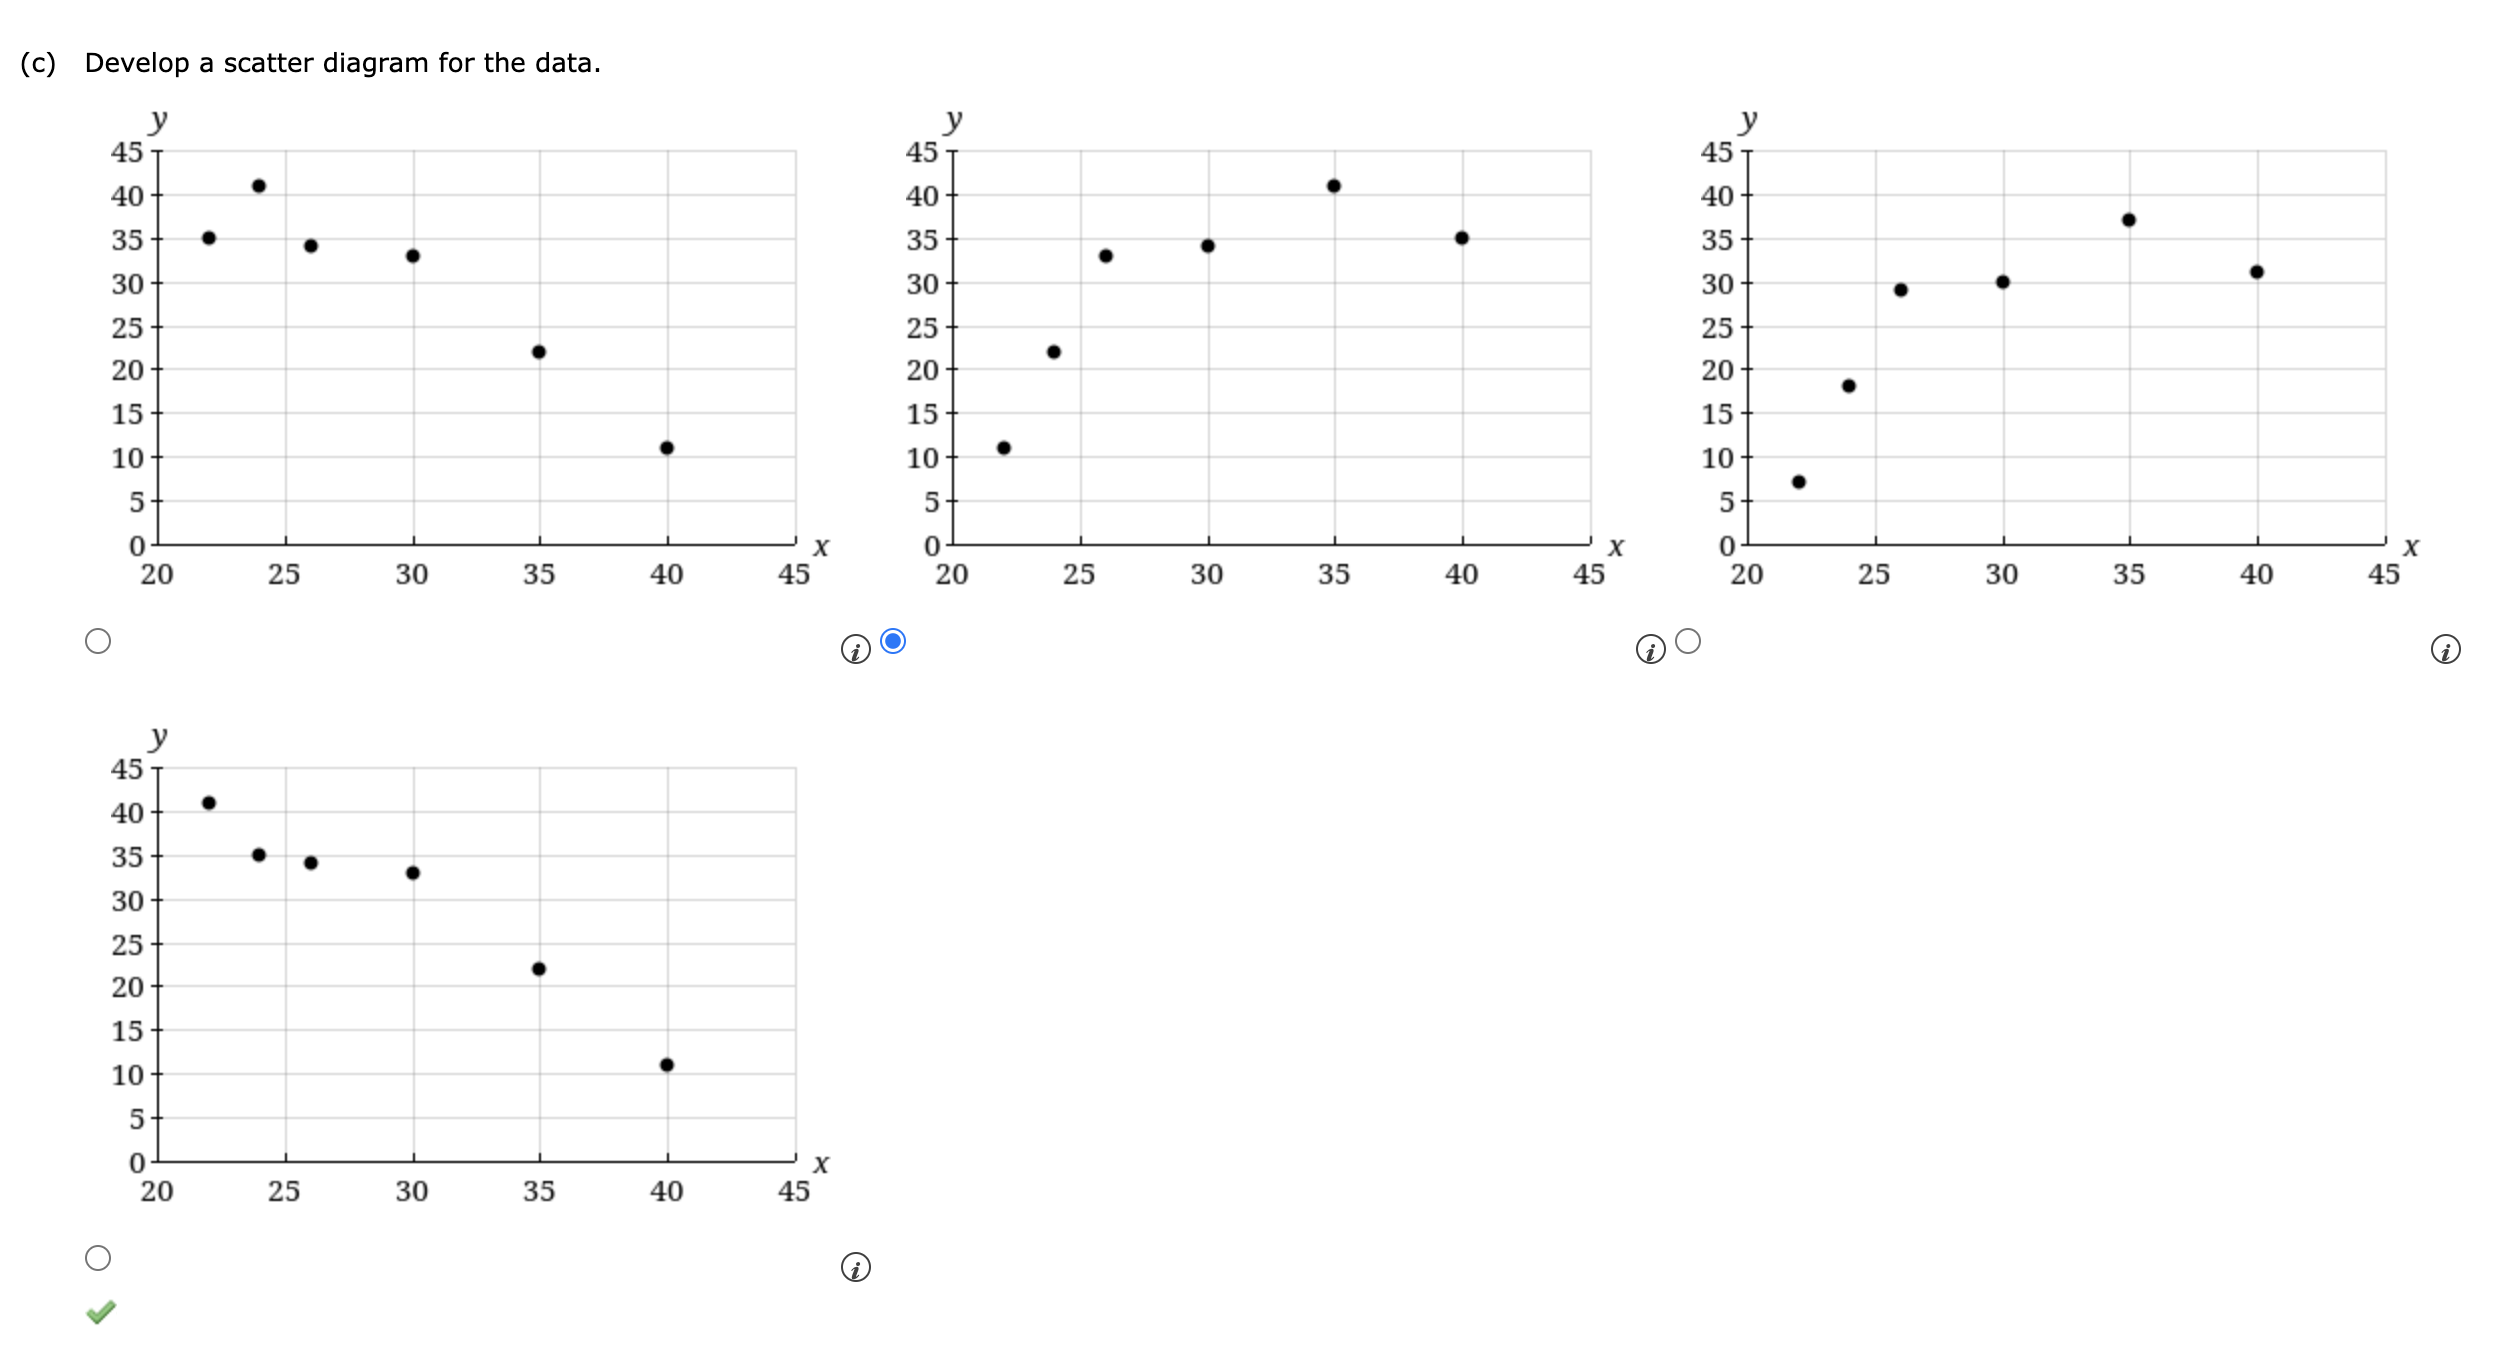
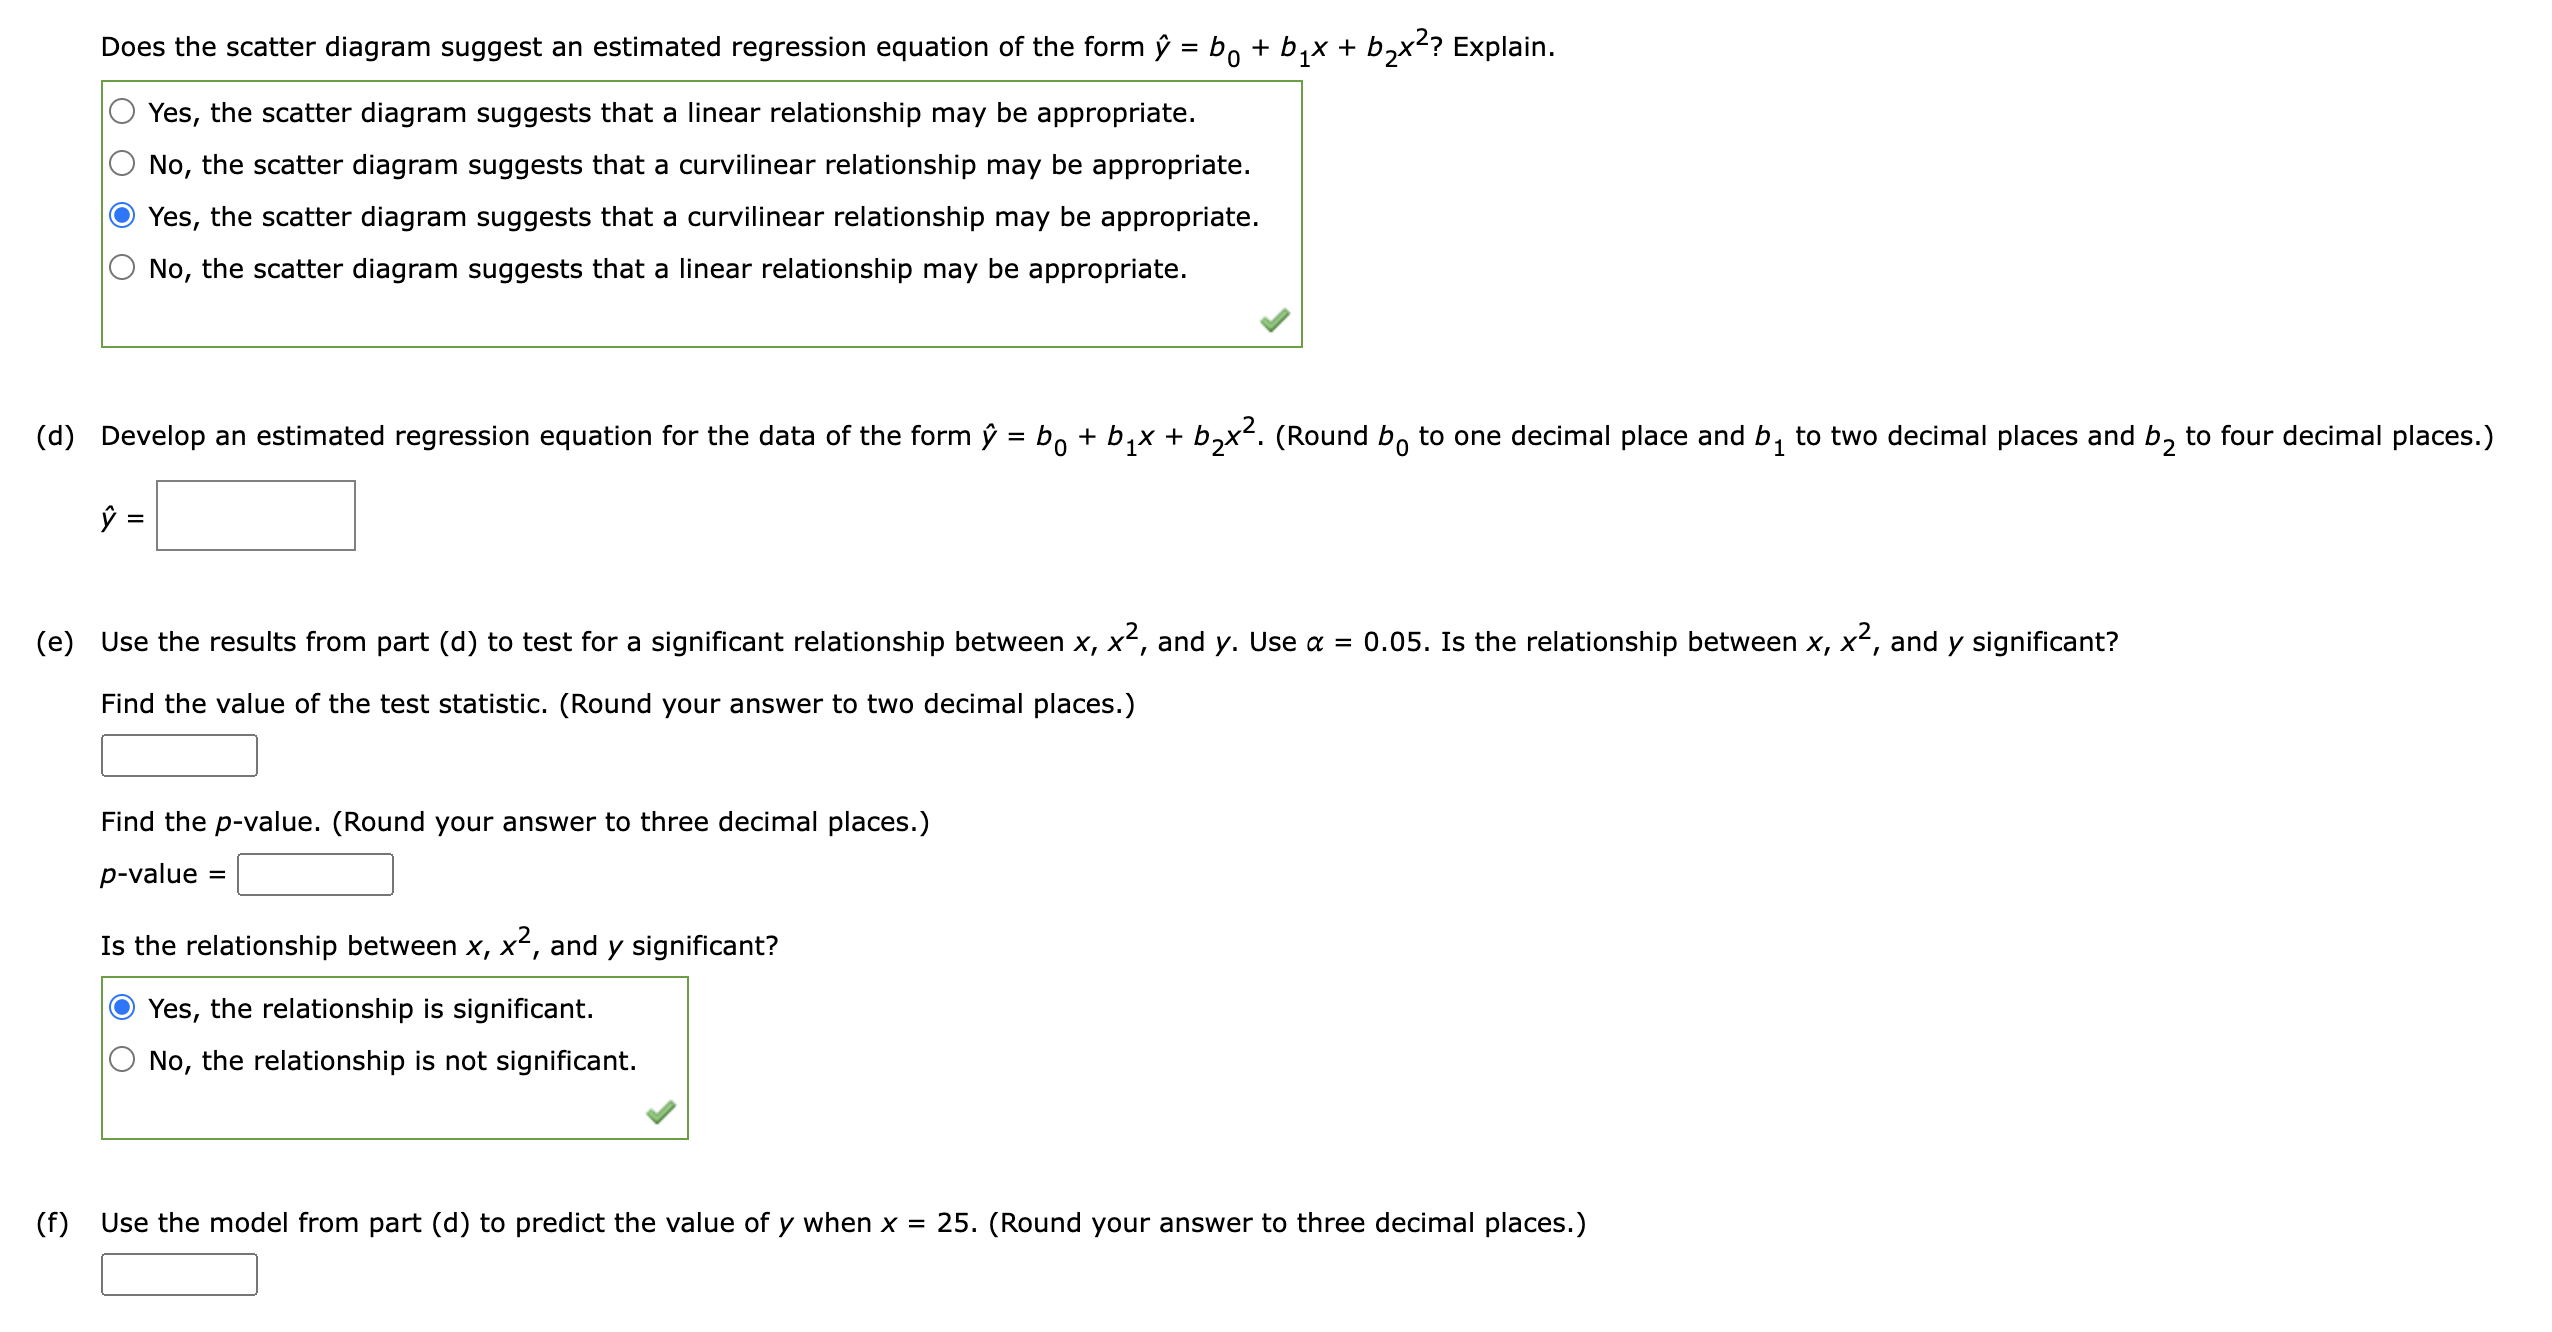
A statistical program is recommended. Consider the following data for two variables, x and y. (a) Develop an estimated regression equation for the data of the form y^=b0+b1x. (Round b0 to one decimal place and b1 to three decimal places.) y^= (b) Use the results from part (a) to test for a significant relationship between x and y. Use =0.05. Find the value of the test statistic. (Round your answer to two decimal places.) F= Find the p-value. (Round your answer to three decimal places.) p-value= Is the relationship between x and y significant? Yes, the relationship is significant. No, the relationship is not significant. (c) Develop a scatter diagram for the data. Does the scatter diagram suggest an estimated regression equation of the form y^=b0+b1x+b2x2? Explain. Yes, the scatter diagram suggests that a linear relationship may be appropriate. No, the scatter diagram suggests that a curvilinear relationship may be appropriate. Yes, the scatter diagram suggests that a curvilinear relationship may be appropriate. No, the scatter diagram suggests that a linear relationship may be appropriate. Develop an estimated regression equation for the data of the form y^=b0+b1x+b2x2. (Round b0 to one decimal p y^= Use the results from part (d) to test for a significant relationship between x,x2, and y. Use =0.05. Is the relations Find the value of the test statistic. (Round your answer to two decimal places.) Find the p-value. (Round your answer to three decimal places.) p-value = Is the relationship between x,x2, and y significant? Yes, the relationship is significant. No, the relationship is not significant. Use the model from part (d) to predict the value of y when x=25. (Round your answer to three decimal places.)
Step by Step Solution
There are 3 Steps involved in it

Get step-by-step solutions from verified subject matter experts