

Question: 14) Given the following data: 10 5 1 15 5 16 2 12 3 30 2 10 7 Deterinine the first quartile (Q.). the third

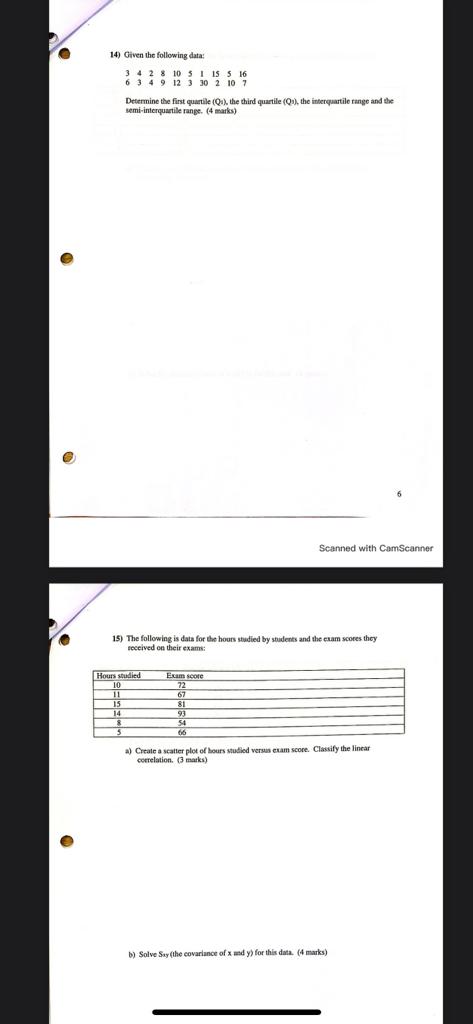
14) Given the following data: 10 5 1 15 5 16 2 12 3 30 2 10 7 Deterinine the first quartile (Q.). the third quartile (Q:), the interquartile range and the semi-interquartile range. (4 marks) Scanned with CamScanner 15) The following is date for the hours studied by students and the exam scores they Received on their exams: Hours studied Exam score 10 72 11 67 15 81 14 al Create a scatter plot of hours studied vermin cram score. Classify the linear correlation. (3 marks) b) Solve Say(the covariance of x mad y) for this data. (4 marks)
Step by Step Solution
There are 3 Steps involved in it
1 Expert Approved Answer
Step: 1 Unlock

Question Has Been Solved by an Expert!
Get step-by-step solutions from verified subject matter experts
Step: 2 Unlock
Step: 3 Unlock