

Question: 3.0 CALCULATE CENTRAL TENDENCY FOR GROUP DATA Customers Number Midpoint Cumulative (FX) Lower Upper Class ages of (x) Frequency Boundary Boundary Boundary people (F) (CB)
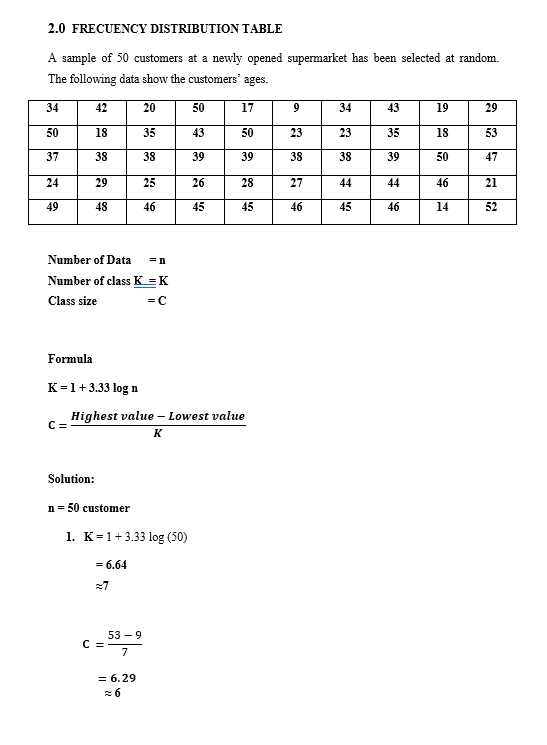
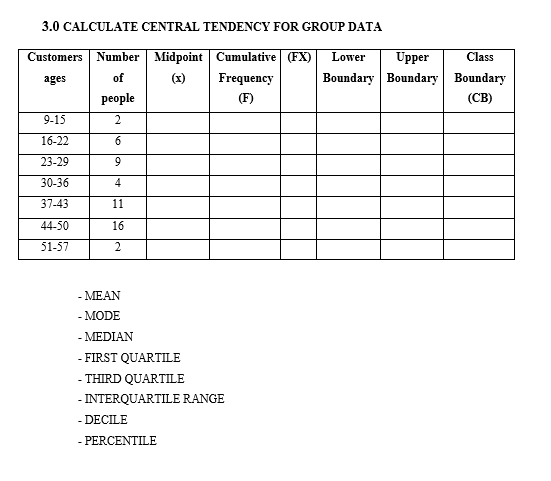
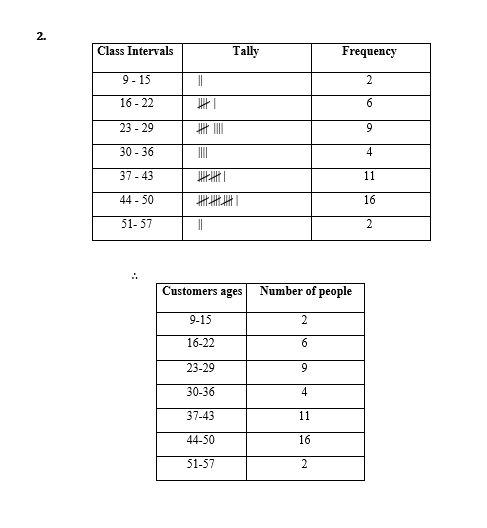

3.0 CALCULATE CENTRAL TENDENCY FOR GROUP DATA Customers Number Midpoint Cumulative (FX) Lower Upper Class ages of (x) Frequency Boundary Boundary Boundary people (F) (CB) 9-15 2 16-22 6 23-29 9 30-36 4 37-43 11 44-50 16 51-57 2 - MEAN - MODE MEDIAN - FIRST QUARTILE - THIRD QUARTILE - INTERQUARTILE RANGE - DECILE - PERCENTILE2. Class Intervals Tally Frequency 9 - 15 16 - 22 23 - 29 9 30 -36 4 37 -43 11 44 - 50 16 51-57 2 Customers ages Number of people 9-15 2 16-22 23-29 9 30-36 4 37-43 11 44-50 16 51-57 22.0 FRECUENCY DISTRIBUTION TABLE A sample of 50 customers at a newly opened supermarket has been selected at random. The following data show the customers' ages. 34 42 20 50 17 34 43 19 50 29 18 35 13 23 23 35 18 37 38 53 38 39 39 38 38 39 50 47 24 29 25 26 28 27 14 44 46 19 48 21 46 45 45 46 45 46 14 52 Number of Data =n Number of class K = K Class size = C Formula K =1 +3.33 log n C= Highest value - Lowest value K Solution: n = 50 customer 1. K=1+3.33 log (50) = 6.64 =7 53 -9 C= 7 = 6.29
Step by Step Solution
There are 3 Steps involved in it

Get step-by-step solutions from verified subject matter experts