

Question: 14-10 BREAKEVEN AND OPERATING LEVERAGE a. Given the following graphs, calculate the total fixed costs, variable costs per unit, and sales price for Firm A.
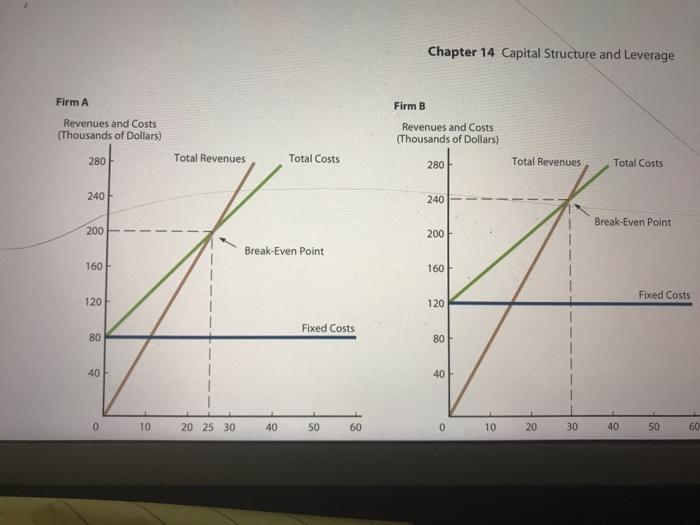
14-10 BREAKEVEN AND OPERATING LEVERAGE a. Given the following graphs, calculate the total fixed costs, variable costs per unit, and sales price for Firm A. Firm B's fixed costs are $120,000, its variable costs per unit are $4, and its sales price is $8 per unit. b. Which firm has the higher operating leverage at any given level of sales? Explain. c. At what sales level, in units, do both firms earn the same operating profit? Chapter 14 Capital Structure and Leverage Firm A Firm B Revenues and Costs (Thousands of Dollars) Revenues and Costs (Thousands of Dollars) 280 Total Revenues Total Costs 280 Total Revenues Total Costs 240 240 Break-Even Point 200 200 Break-Even Point 160 160 Fixed Costs 120 120 Fixed Costs 80 80 40 40 0 10 20 25 30 40 50 60 0 10 20 30 40 50 60
Step by Step Solution
There are 3 Steps involved in it

Get step-by-step solutions from verified subject matter experts