

Question: a. Given the following graphs, calculate the total fixed costs, variable costs per unit, and sales price for Firm A. Firm Bs fixed costs are
a. Given the following graphs, calculate the total fixed costs, variable costs per unit, and sales price for Firm A. Firm B’s fixed costs are $120,000, its variable costs per unit are $4, and its sales price is $8 per unit.
b. Which firm has the higher operating leverage at any given level of sales? Explain.
c. At what sales level, in units, do both firms earn the same operating profit?
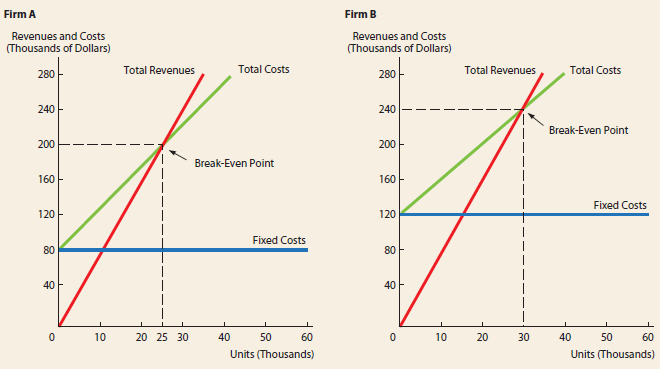
Firm B Firm A Revenues and Costs (Thousands of Dollars) Revenues and Costs (Thousands of Dollars) Total Costs Total Costs Total Revenues Total Revenues 280 280 240 240 Break-Even Point 200 200 Break-Even Point 160 160 Fixed Costs 120 120 Fixed Costs 80 80 40 40 10 20 25 30 40 50 60 10 20 30 40 50 60 Units (Thousands) Units (Thousands)
Step by Step Solution
3.31 Rating (154 Votes )
There are 3 Steps involved in it
a Firm A 1 Fixed costs 80000 2 Variable costunit 3 Selling priceunit Firm B 1 Fixe... View full answer

Get step-by-step solutions from verified subject matter experts
Document Format (1 attachment)
43-B-C-F-C-S (80).docx
120 KBs Word File