

Question: 14.3 Excel Activity 1b - Regression Equations, Predictions, and Coefficient of Determination with XLMiner: An important application of regression analysis in accounting is in the
14.3 Excel Activity 1b - Regression Equations, Predictions, and Coefficient of Determination with XLMiner:
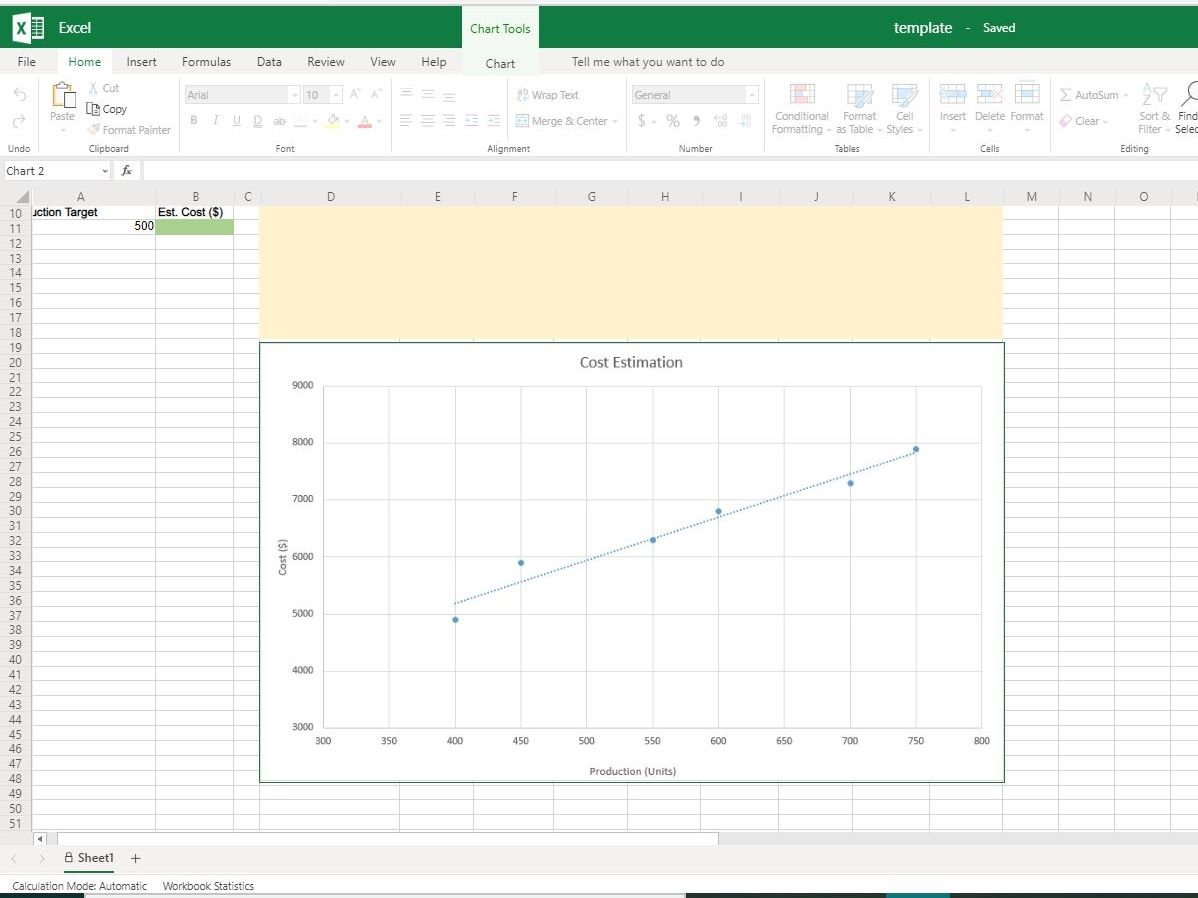
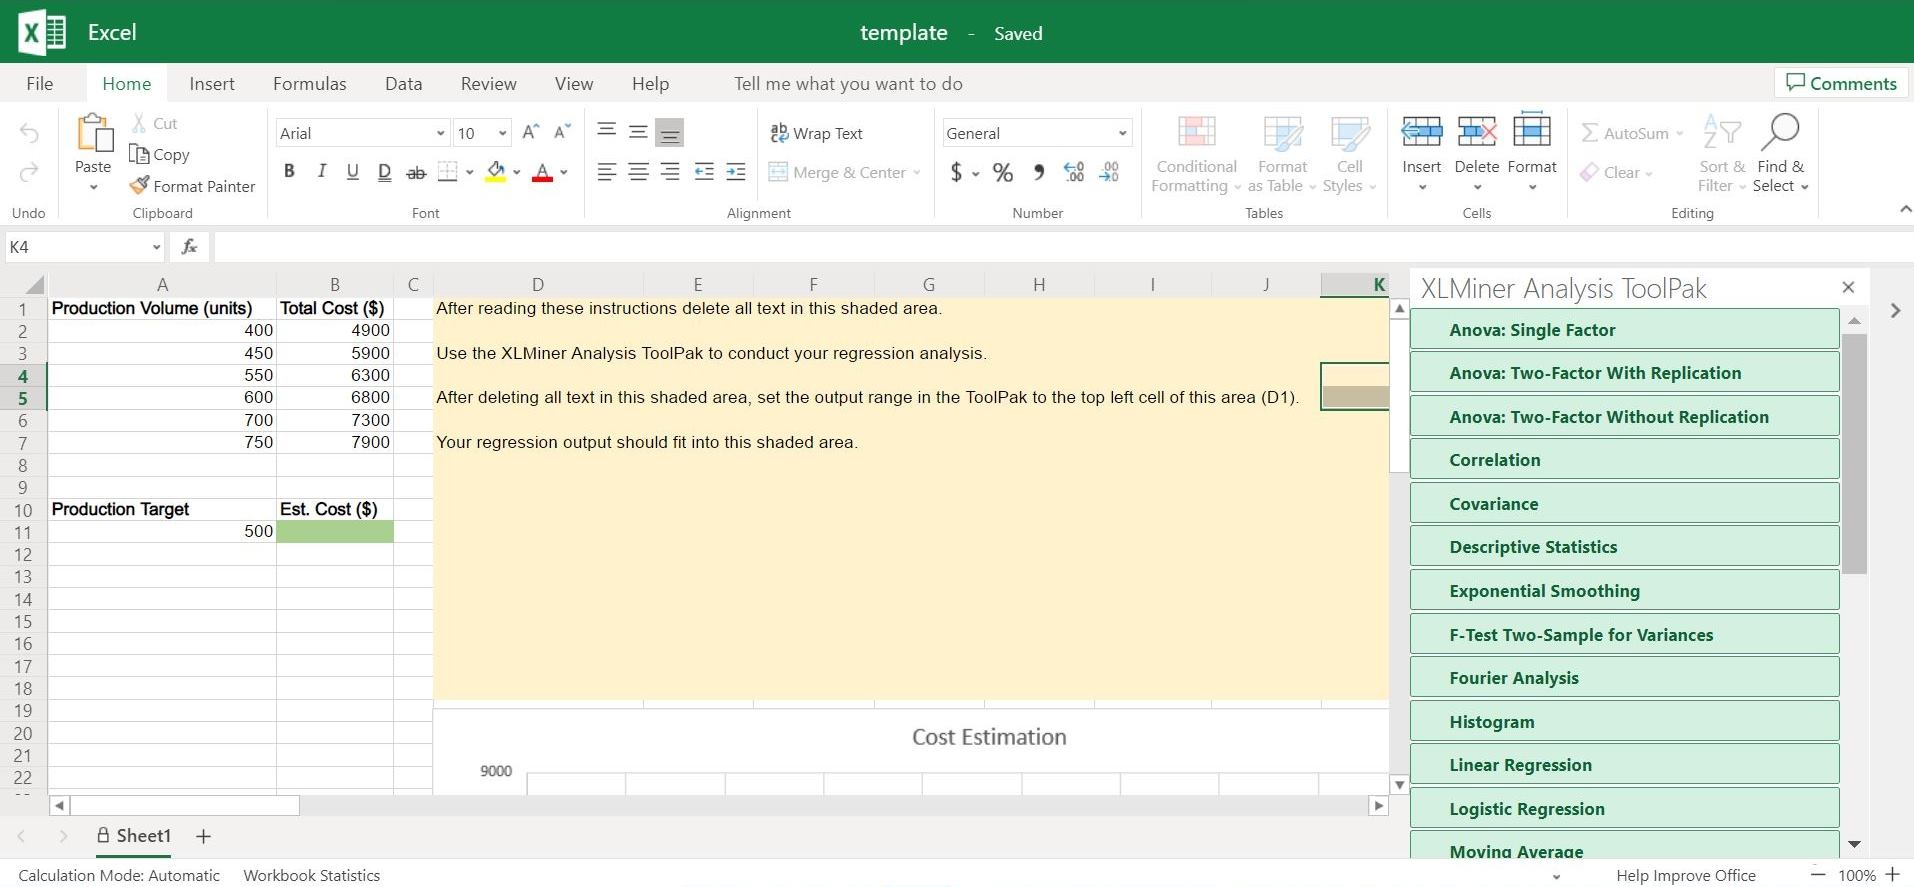
An important application of regression analysis in accounting is in the estimation of cost. By collecting data on volume and cost and using the least squares method to develop an estimated regression equation relating volume and cost, an accountant can estimate the cost associated with a particular manufacturing volume.
In the Microsoft Excel Online file below you will find a sample of production volumes and total cost data for a manufacturing operation. Conduct a regression analysis to explore the relationship between total cost and production volume and then answer the questions that follow.
(EXCELL ATTACHED)
a) Computeb1andb0(to 1 decimal).
b1___________
b0___________
Complete the estimated regression equation (to 1 decimal).
=____________+ _______________x
b) According to this model, what is the change in cost (in dollars) for every unit produced (to 1 decimal)? ______________
c) Compute the coefficient of determination (to 3 decimals). Note: reportr2between 0 and 1.
r2=____________
What percentage of the variation in total cost can be explained by the production volume (to 1 decimal)? __________ %
d) The company's production schedule shows 500 units must be produced next month. What is the estimated total cost for this operation (to the nearest whole number)? ________$
Excel Chart Tools template - Saved File Home Insert Formulas Data Review View Help Chart Tell me what you want to do Cut Arial -10 - A A E Wrap Text General Autosum - 7 Past LE Copy = Merge & Center - 5 - % 5 28 -48 Conditional Format Cell Insert Delete Format Clear Sort & Find Format Painter Formatting - as Table - Styles - Filter - Sele Undo Clipboard Font Alignment Number Tables Cells Editing Chart 2 N O A B C D E F G H K L M 10 action Target Est. Cost ($) 500 Cost Estimation 9000 8000 7000 6000 Cost ($ 5000 4000 3000 300 350 400 450 500 550 600 650 700 750 47 48 Production (Units] 49 51 A Sheet1 + Calculation Mode: Automatic Workbook StatisticsX Excel template - Saved File Home Insert Formulas Data Review View Help Tell me what you want to do Comments X Cut Arial 10 " A" A a Wrap Text General AutoSum ~ Paste [ Copy Format Painter BIUDab Av Merge & Center $ ~ % 9 08 Conditional Format Cell Insert Delete Format Sort & Find & Formatting . as Table . Styles Clear ~ Filter . Select ~ Undo Clipboard Font Alignment Number Tables Cells Editing K4 fx A B C D E G H K X SO NO UI A W N - Production Volume (units) Total Cost ($) After reading these instructions delete all text in this shaded area. A XLMiner Analysis ToolPak > 400 4900 Anova: Single Factor 450 5900 Use the XLMiner Analysis ToolPak to conduct your regression analysis. 550 6300 Anova: Two-Factor With Replication 600 6800 After deleting all text in this shaded area, set the output range in the ToolPak to the top left cell of this area (D1). 700 7300 Anova: Two-Factor Without Replication 750 7900 Your regression output should fit into this shaded area. Correlation Production Target Est. Cost ($) Covariance 11 500 12 Descriptive Statistics 13 Exponential Smoothing 14 15 16 F-Test Two-Sample for Variances 17 Fourier Analysis 18 19 20 Cost Estimation Histogram 21 9000 Linear Regression 4 Logistic Regression A Sheet1 + Movina Average Calculation Mode: Automatic Workbook Statistics Help Improve Office - 100% +
Step by Step Solution
There are 3 Steps involved in it

Get step-by-step solutions from verified subject matter experts