

Question: 145 MARKS SECTION B - SHORT ANSWER QUESTIONS. Answer ALL questions in this section. 5 1. Represent the data below in a frequency and cumulative
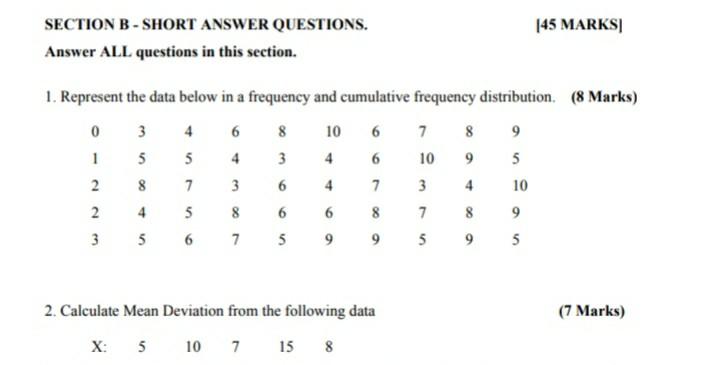
145 MARKS SECTION B - SHORT ANSWER QUESTIONS. Answer ALL questions in this section. 5 1. Represent the data below in a frequency and cumulative frequency distribution. (8 Marks) 0 3 4 6 8 10 6 7 8 9 15 5 4 3 4 6 10 9 5 2 8 7 3 6 4 7 3 4 10 2 4 5 8 6 6 8 7 8 9 3 5 6 7 5 9 95 9 5 6 6 8 (7 Marks) 2. Calculate Mean Deviation from the following data X: 5 7 8 10 15
Step by Step Solution
There are 3 Steps involved in it
1 Expert Approved Answer
Step: 1 Unlock

Question Has Been Solved by an Expert!
Get step-by-step solutions from verified subject matter experts
Step: 2 Unlock
Step: 3 Unlock