

Question: 1.45. Refer to the SENIC data set in Appendix C.1. The average length of stay in a hospital (Y) is anticipated to be related to
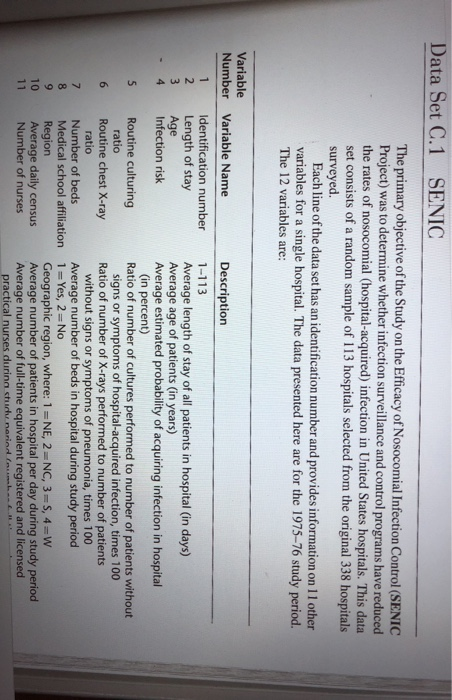

1.45. Refer to the SENIC data set in Appendix C.1. The average length of stay in a hospital (Y) is anticipated to be related to infection risk, available facilities and services, and routine chest X-ray ratio. Assume that first-order regression model (1.1) is appropriate for each of the three predictor variables. a. Regress average length of stay on each of the three predictor variables. State the estimated regression functions. b. Plot the three estimated regression functions and data on separate graphs. Does a linear relation appear to provide a good fit for each of the three predictor variables? c. Calculate MSE for each of the three predictor variables. Which predictor variable leads to the smallest variability around the fitted regression line? Data Set C.1 SENIC The primary objective of the Study on the Efficacy of Nosocomial Infection Control (SENIC Project) was to determine whether infection surveillance and control programs have reduced the rates of nosocomial (hospital-acquired) infection in United States hospitals. This data set consists of a random sample of 113 hospitals selected from the original 338 hospitals surveyed. Each line of the data set has an identification number and provides information on 11 other variables for a single hospital. The data presented here are for the 1975-76 study period. The 12 variables are: Variable Number 1 2 3 4 5 Variable Name Description Identification number 1-113 Length of stay Average length of stay of all patients in hospital (in days) Age Average age of patients (in years) Infection risk Average estimated probability of acquiring infection in hospital (in percent) Routine culturing Ratio of number of cultures performed to number of patients without ratio signs or symptoms of hospital-acquired infection, times 100 Routine chest X-ray Ratio of number of X-rays performed to number of patients ratio without signs or symptoms of pneumonia, times 100 Number of beds Average number of beds in hospital during study period Medical school affiliation 1 = Yes, 2 =No Region Geographic region, where: 1 = NE, 2 -NC, 3=S, 4 =W Average daily census Average number of patients in hospital per day during study period Number of nurses Average number of full-time equivalent registered and licensed practical nurses during studu neriod Inim. 6 7 8 9 10 11 show up SAS Code thank you 1.45. Refer to the SENIC data set in Appendix C.1. The average length of stay in a hospital (Y) is anticipated to be related to infection risk, available facilities and services, and routine chest X-ray ratio. Assume that first-order regression model (1.1) is appropriate for each of the three predictor variables. a. Regress average length of stay on each of the three predictor variables. State the estimated regression functions. b. Plot the three estimated regression functions and data on separate graphs. Does a linear relation appear to provide a good fit for each of the three predictor variables? c. Calculate MSE for each of the three predictor variables. Which predictor variable leads to the smallest variability around the fitted regression line? Data Set C.1 SENIC The primary objective of the Study on the Efficacy of Nosocomial Infection Control (SENIC Project) was to determine whether infection surveillance and control programs have reduced the rates of nosocomial (hospital-acquired) infection in United States hospitals. This data set consists of a random sample of 113 hospitals selected from the original 338 hospitals surveyed. Each line of the data set has an identification number and provides information on 11 other variables for a single hospital. The data presented here are for the 1975-76 study period. The 12 variables are: Variable Number 1 2 3 4 5 Variable Name Description Identification number 1-113 Length of stay Average length of stay of all patients in hospital (in days) Age Average age of patients (in years) Infection risk Average estimated probability of acquiring infection in hospital (in percent) Routine culturing Ratio of number of cultures performed to number of patients without ratio signs or symptoms of hospital-acquired infection, times 100 Routine chest X-ray Ratio of number of X-rays performed to number of patients ratio without signs or symptoms of pneumonia, times 100 Number of beds Average number of beds in hospital during study period Medical school affiliation 1 = Yes, 2 =No Region Geographic region, where: 1 = NE, 2 -NC, 3=S, 4 =W Average daily census Average number of patients in hospital per day during study period Number of nurses Average number of full-time equivalent registered and licensed practical nurses during studu neriod Inim. 6 7 8 9 10 11 show up SAS Code thank you
Step by Step Solution
There are 3 Steps involved in it

Get step-by-step solutions from verified subject matter experts