

Question: 9.25 Refer to the SENIC data set in Appendix C.l. Length of stay (Y) is to be predicted, and the pool of potential predictor variables
9.25 Refer to the SENIC data set in Appendix C.l. Length of stay (Y) is to be predicted, and the pool of potential predictor variables includes all other variables in the data set except medical school affiliation and region. It is believed that a model with 10gLOYas the response variable and the predictor variables in first-order terms with no interaction terms will be appropriate. Consider cases 57-1l3 to constitute the model-building data set to be used for the following analyses.
1.Prepare separate dot plots for each of the predictor variables. Are there any noteworthy features in these plots? Comment.
2.Obtain the scatter plot matrix.Also obtain the correlation matrix of the X variables.Is there evidence of strong linear pairwise associations among the predictor variables here?
3.Obtain the three best subsets according to the Cpcriterion, Which of these subset models appears to have the smallest bias?
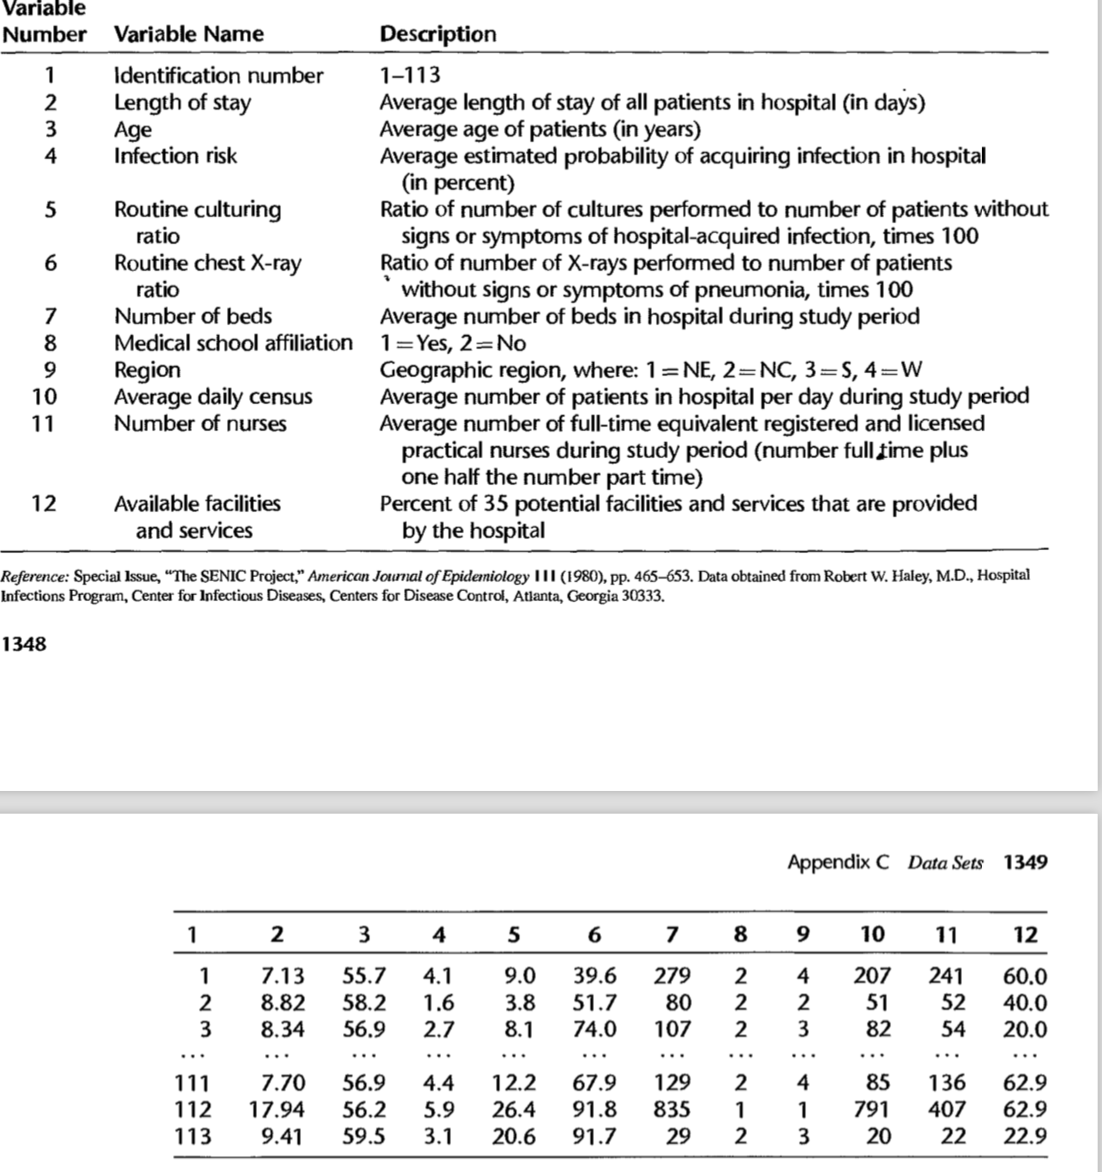
Variable Number Variable Name Description Identification number 1-113 WN - Length of stay Average length of stay of all patients in hospital (in days) Age Average age of patients (in years) Infection risk Average estimated probability of acquiring infection in hospital (in percent) 5 Routine culturing Ratio of number of cultures performed to number of patients without ratio signs or symptoms of hospital-acquired infection, times 100 6 Routine chest X-ray Ratio of number of X-rays performed to number of patients ratio without signs or symptoms of pneumonia, times 100 V Number of beds Average number of beds in hospital during study period Medical school affiliation 1 =Yes, 2= No Region Geographic region, where: 1 = NE, 2=NC, 3=$, 4= W 10 Average daily census Average number of patients in hospital per day during study period 11 Number of nurses Average number of full-time equivalent registered and licensed practical nurses during study period (number full time plus one half the number part time) 12 Available facilities Percent of 35 potential facilities and services that are provided and services by the hospital Reference: Special Issue, "The SENIC Project," American Journal of Epidemiology III (1980), pp. 465-653. Data obtained from Robert W. Haley, M.D., Hospital Infections Program, Center for Infectious Diseases, Centers for Disease Control, Atlanta, Georgia 30333. 1348 Appendix C Data Sets 1349 1 2 3 4 5 6 7 8 9 10 11 12 7.13 55.7 4.1 9.0 39.6 279 2 4 207 241 60.0 8.82 58.2 1.6 3.8 80 N WN - 51.7 2 51 52 40.0 8.34 56.9 2.7 8.1 74.0 107 3 82 54 20.0 . . . . . . . . . . . 111 7.70 56.9 4.4 12.2 67.9 129 85 N 4 136 62.9 112 17.94 56.2 5.9 26.4 91.8 835 791 407 62.9 W - 113 9.41 59.5 3.1 20.6 91.7 29 N 20 22 22.9
Step by Step Solution
There are 3 Steps involved in it

Get step-by-step solutions from verified subject matter experts