

Question: 149 QUALITY CONTROL = 7.6 + 1.51 = 9.11 LCL = 7.6 (0.58 x 2.6) = 6.09 For R chart UCL = 2.11 x 2.6
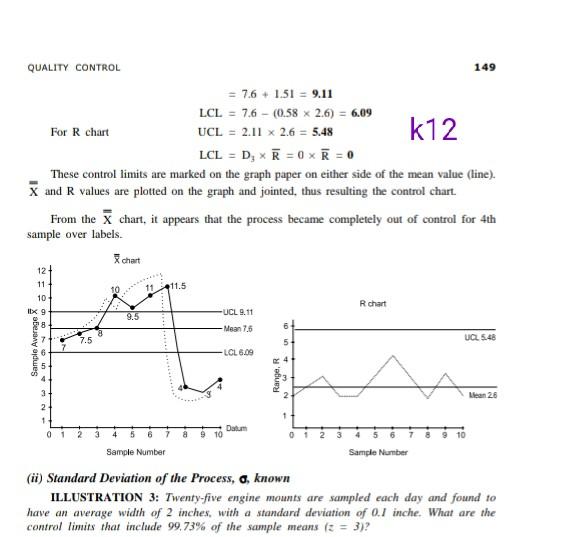
149 QUALITY CONTROL = 7.6 + 1.51 = 9.11 LCL = 7.6 (0.58 x 2.6) = 6.09 For R chart UCL = 2.11 x 2.6 = 5.48 k12 LCL = D, R=0x = 0 These control limits are marked on the graph paper on either side of the mean value (line). X and R values are plotted on the graph and jointed, thus resulting the control chart. From the chart, it appears that the process became completely out of control for 4th sample over labels. chart 11 11.5 12 11 10 IIX 9 8 R chart 9.5 UCL 9.11 Mean 75 7.5 UC 5.48 Sample Average LC1 309 Range, R NA Lean 26 1 1 0 4 5 6 a Datum 9 10 O 2 3 5 7 8 9 10 Sample Number Sample Number (ii) Standard Deviation of the Process, a, known ILLUSTRATION 3: Twenty-five engine mounts are sampled each day and found to have an average width of 2 inches, with a standard deviation of 0.1 inche. What are the control limits that include 99,73% of the sample means is = 3)
Step by Step Solution
There are 3 Steps involved in it
1 Expert Approved Answer
Step: 1 Unlock

Question Has Been Solved by an Expert!
Get step-by-step solutions from verified subject matter experts
Step: 2 Unlock
Step: 3 Unlock