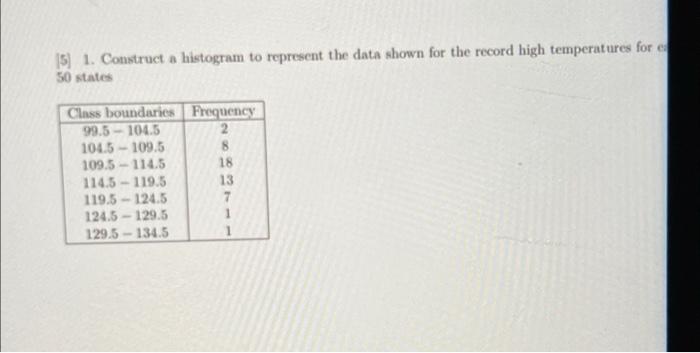
Question: 15) 1. Construct a histogram to represent the data shown for the record high temperatures for a 50 states Class boundaries Frequency 99.5 -104.5 2

15) 1. Construct a histogram to represent the
15) 1. Construct a histogram to represent the data shown for the record high temperatures for a 50 states Class boundaries Frequency 99.5 -104.5 2 104.5 - 109.5 8 109.5 -114.5 18 114.5 -119.5 13 119.5 -124.5 7 124.5 - 129.5 1 129.5 - 134.5 8 18 2. The treatment times in minutes) for patients at a health clinic are as follows: 21 20 31 24 15 21 24 18 33 26 17 27 29 24 14 2941 15 11 13 28 22 16 12 15 11 16 18 17 () Find the 25th, 50th, 76th percentiles and the Interquartile range: (6) Construct a box plot (c) The bealth clinic advertises that 90% of all its patients have a treatment time of 40 minutes or less. Do the data support this claim

Step by Step Solution

There are 3 Steps involved in it

1 Expert Approved Answer
Step: 1 Unlock blur-text-image
Question Has Been Solved by an Expert!

Get step-by-step solutions from verified subject matter experts

Step: 2 Unlock
Step: 3 Unlock

Students Have Also Explored These Related General Management Questions!