

Question: Construct a histogram to represent the data shown for the record high temperatures for each of the 50 states Class boundaries Frequency 99.5-104.5 104.5-109.5 109.5-114.5
Construct a histogram to represent the data shown for the record high temperatures for
each of the 50 states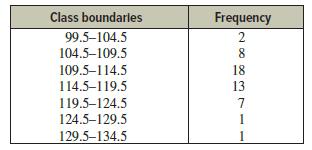
Class boundaries Frequency 99.5-104.5 104.5-109.5 109.5-114.5 18 114.5-119.5 13 20 83 8 119.5-124.5 7 124.5-129.5 1 129.5-134.5
Step by Step Solution
★★★★★
3.57 Rating (157 Votes )
There are 3 Steps involved in it
1 Expert Approved Answer
Step: 1 Unlock

Step 1 Draw and label the x and y axes The x axis is always the horizontal axis and the y axis is ... View full answer
Question Has Been Solved by an Expert!
Get step-by-step solutions from verified subject matter experts
Step: 2 Unlock
Step: 3 Unlock