Question: = 15) An article gave a scatter plot, along with the least squares line, of x = rainfall volume (m3) and y = runoff volume
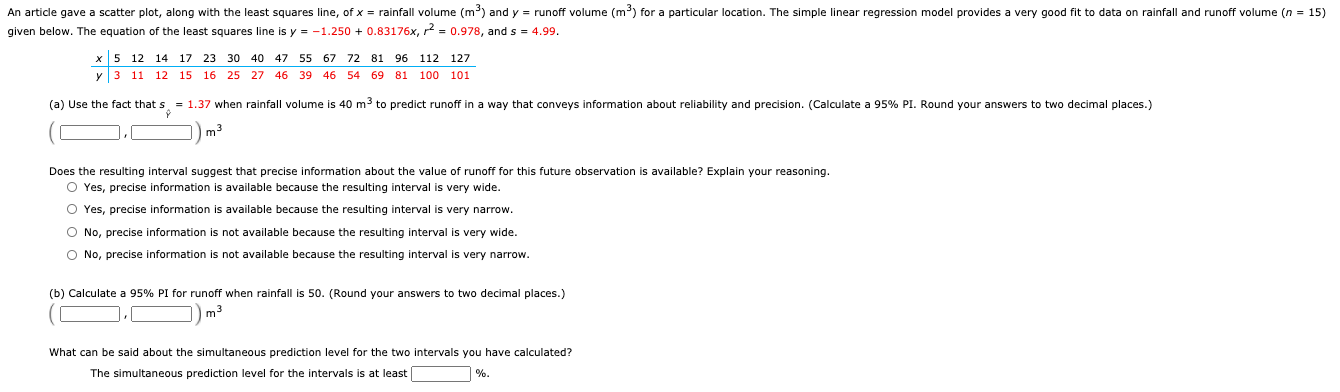
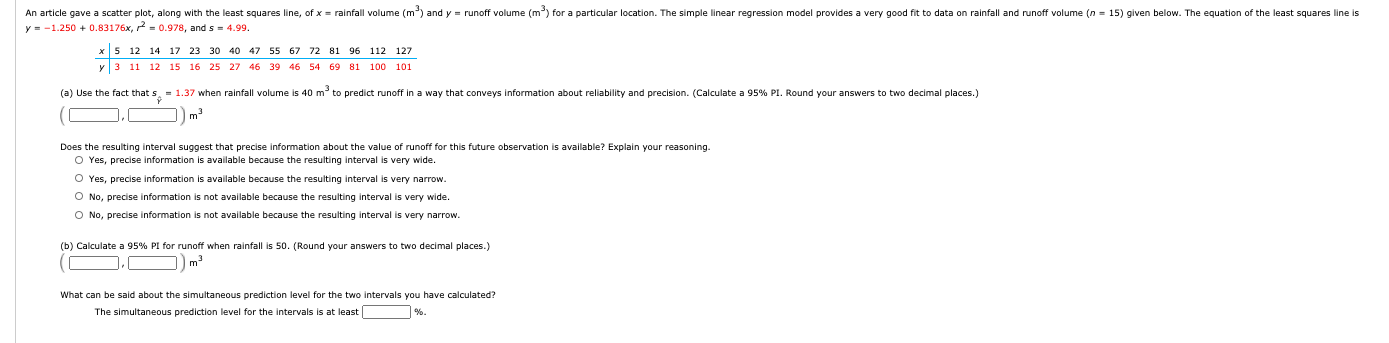
= 15) An article gave a scatter plot, along with the least squares line, of x = rainfall volume (m3) and y = runoff volume (m3) for a particular location. The simple linear regression model provides a very good fit to data on rainfall and runoff volume given below. The equation of the least squares line is y = -1.250 + 0.83176x, r2 = 0.978, and s = 4.99. x 5 12 14 17 23 30 40 47 55 67 72 81 96 112 127 y3 11 12 15 16 25 27 46 39 46 54 69 81 100 101 (a) Use the fact that s = 1.37 when rainfall volume is 40 m3 to predict runoff in a way that conveys information about reliability and precision. (Calculate a 95% PI. Round your answers to two decimal places.) m Does the resulting interval suggest that precise information about the value of runoff for this future observation is available? Explain your reasoning. Yes, precise information is available because the resulting interval is very wide. Yes, precise information is available because the resulting interval is very narrow. O No, precise information is not available because the resulting interval is very wide. No, precise information is not available because the resulting interval is very narrow. (b) Calculate a 95% PI for runoff when rainfall is 50. (Round your answers to two decimal places.) What can be said about the simultaneous prediction level for the two intervals you have calculated? The simultaneous prediction level for the intervals is at least An article gave a scatter plot, along with the least squares line, of x = rainfall volume (m) and y = runoff volume (m) for a particular location. The simple linear regression model provides a very good fit to data on rainfall and runoff volume (n = 15) given below. The equation of the least squares line is y = -1.250 + 0.83176x, 2 = 0.978, and s = 4.99. x 5 12 14 17 23 30 40 47 55 67 72 81 96 112 127 y 3 11 12 15 16 25 27 46 39 46 54 69 81 100 101 (a) Use the fact that s. - 1.37 when rainfall volume is 40 m to predict runoff in a way that conveys information about reliability and precision. (Calculate a 95% PI. Round your answers to two decimal places.) mp Does the resulting interval suggest that precise information about the value of runoff for this future observation is available? Explain your reasoning. Yes, precise information is available because the resulting interval is very wide. Yes, precise information is available because the resulting interval is very narrow. O No, precise information is not available because the resulting interval is very wide. No, precise information is not available because the resulting interval is very narrow. (b) Calculate a 95% PI for runoff when rainfall is 50. (Round your answers two decimal places.) What can be said about the simultaneous prediction level for the two intervals you have calculated? The simultaneous prediction level for the intervals is at least = 15) An article gave a scatter plot, along with the least squares line, of x = rainfall volume (m3) and y = runoff volume (m3) for a particular location. The simple linear regression model provides a very good fit to data on rainfall and runoff volume given below. The equation of the least squares line is y = -1.250 + 0.83176x, r2 = 0.978, and s = 4.99. x 5 12 14 17 23 30 40 47 55 67 72 81 96 112 127 y3 11 12 15 16 25 27 46 39 46 54 69 81 100 101 (a) Use the fact that s = 1.37 when rainfall volume is 40 m3 to predict runoff in a way that conveys information about reliability and precision. (Calculate a 95% PI. Round your answers to two decimal places.) m Does the resulting interval suggest that precise information about the value of runoff for this future observation is available? Explain your reasoning. Yes, precise information is available because the resulting interval is very wide. Yes, precise information is available because the resulting interval is very narrow. O No, precise information is not available because the resulting interval is very wide. No, precise information is not available because the resulting interval is very narrow. (b) Calculate a 95% PI for runoff when rainfall is 50. (Round your answers to two decimal places.) What can be said about the simultaneous prediction level for the two intervals you have calculated? The simultaneous prediction level for the intervals is at least An article gave a scatter plot, along with the least squares line, of x = rainfall volume (m) and y = runoff volume (m) for a particular location. The simple linear regression model provides a very good fit to data on rainfall and runoff volume (n = 15) given below. The equation of the least squares line is y = -1.250 + 0.83176x, 2 = 0.978, and s = 4.99. x 5 12 14 17 23 30 40 47 55 67 72 81 96 112 127 y 3 11 12 15 16 25 27 46 39 46 54 69 81 100 101 (a) Use the fact that s. - 1.37 when rainfall volume is 40 m to predict runoff in a way that conveys information about reliability and precision. (Calculate a 95% PI. Round your answers to two decimal places.) mp Does the resulting interval suggest that precise information about the value of runoff for this future observation is available? Explain your reasoning. Yes, precise information is available because the resulting interval is very wide. Yes, precise information is available because the resulting interval is very narrow. O No, precise information is not available because the resulting interval is very wide. No, precise information is not available because the resulting interval is very narrow. (b) Calculate a 95% PI for runoff when rainfall is 50. (Round your answers two decimal places.) What can be said about the simultaneous prediction level for the two intervals you have calculated? The simultaneous prediction level for the intervals is at least


