

Question: can I get help Values of modulus of elasticity (MOE, the ratio of stress, i.e , force per unit area, to strain, l.e., deformation per
can I get help
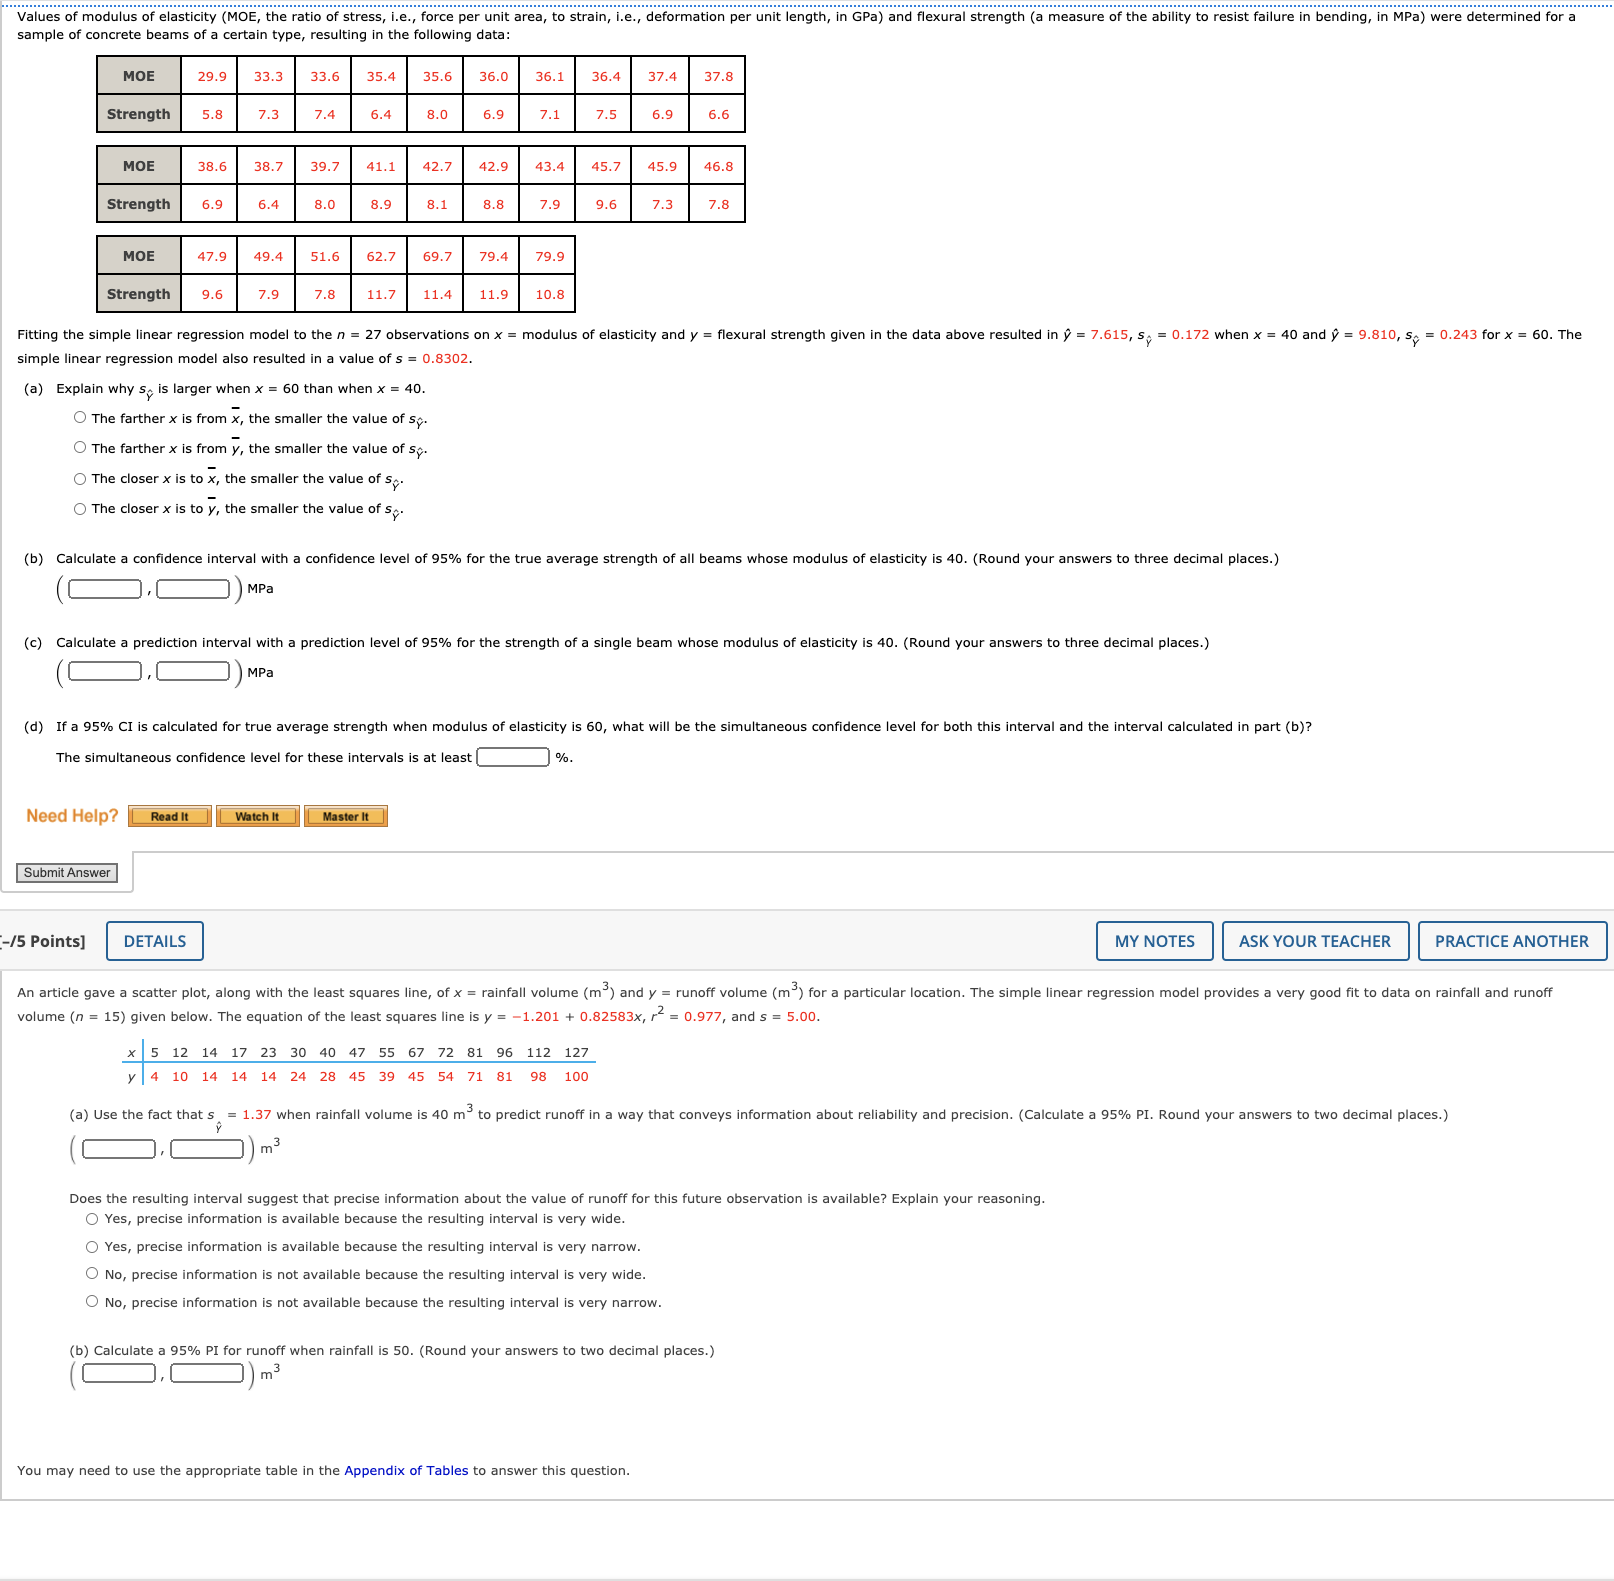
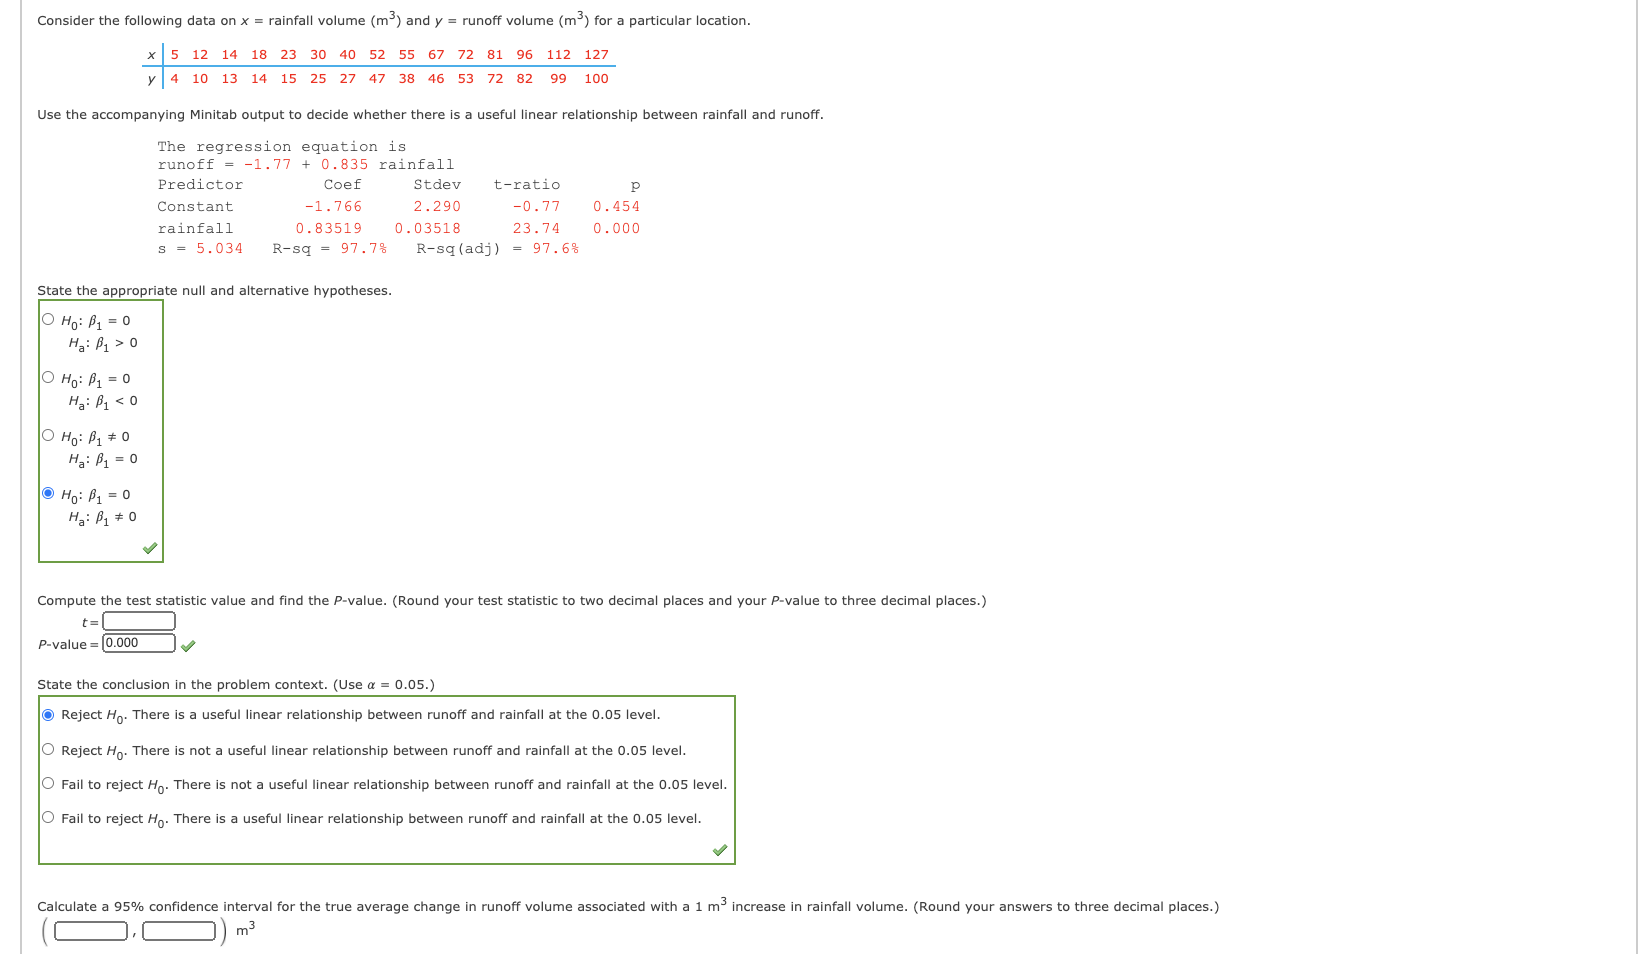
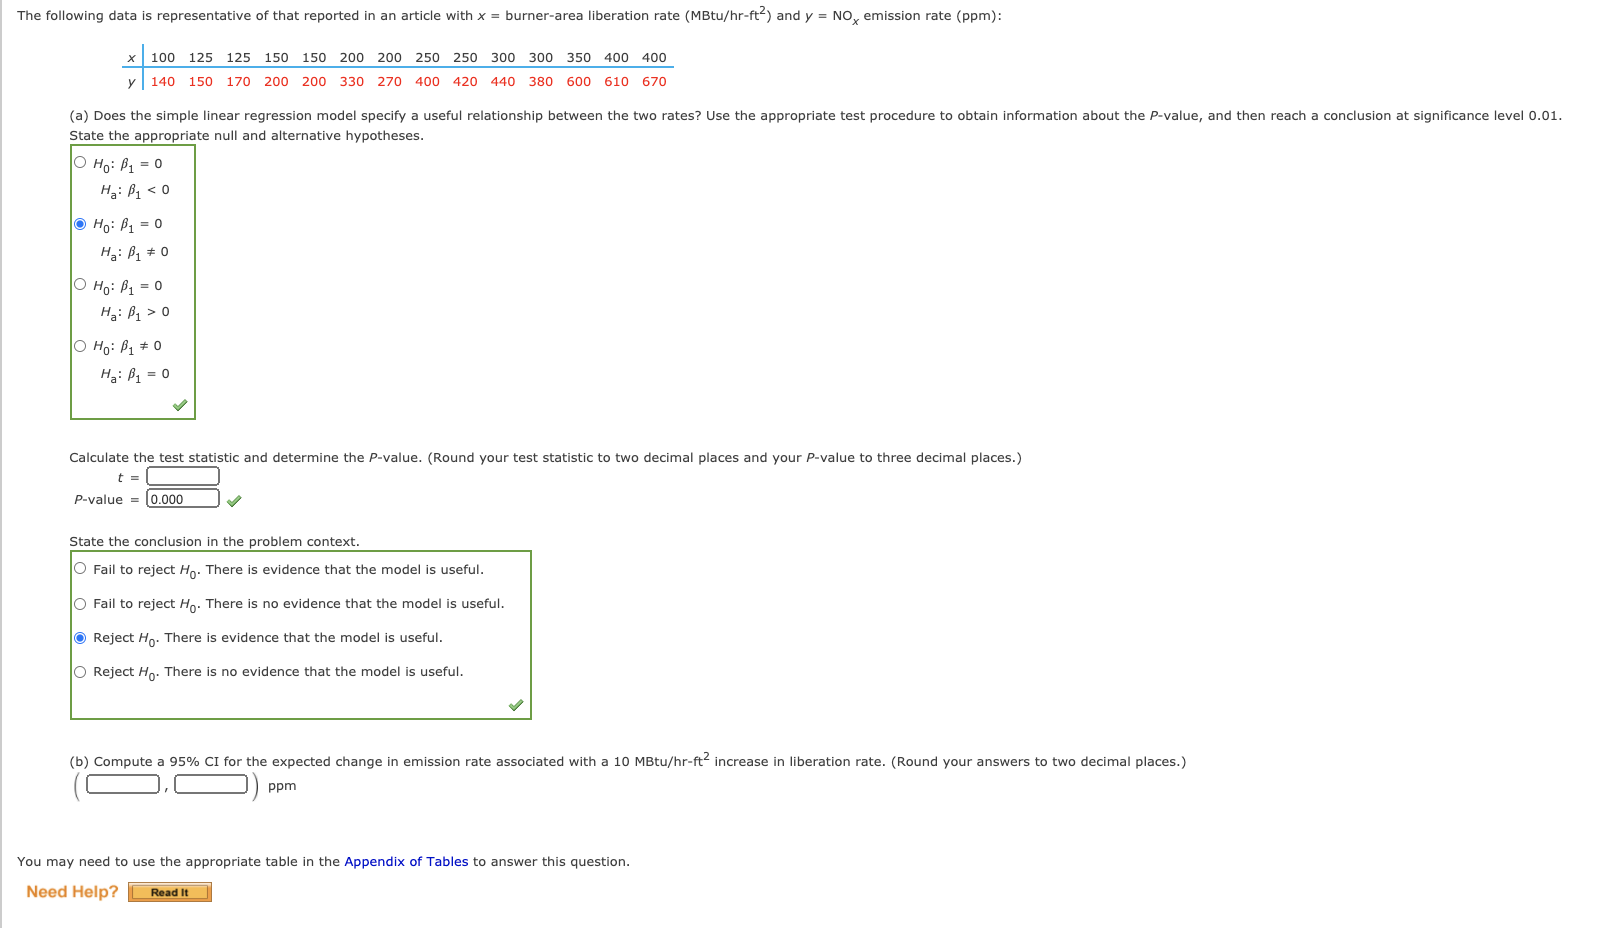
Values of modulus of elasticity (MOE, the ratio of stress, i.e , force per unit area, to strain, l.e., deformation per unit length, in GPa) and flexural strength (a measure of the a sample of concrete beams ofa certain type, resulting in the following data: ity to resist Failure In bending, In MPa) were determined for a Fitting the simple linear regression model to the n - 27 observations on x - modulus of elasticity and y - flexural strength given In the data above resulted in 9 - 7.615, 5f - 0.172 when x - 40 and 3'? - 9.310, s? - 0.243 for x - 60. The simple linear regression model also resulted In a value ofs - 0.5302. {a} Explain why 5? is larger when x - 60 than when x - 4D. 0 The farther x is from Z the smaller the value of 59-. O The farther x is from 1], the smaller the value of 59-. O The closer x is to ;, the smaller the value of 59. O The closer x is to ;, the smaller the value of 59. (b) Calculate a condence Interval with a condence level of 95% for the true average strength of all beams whose modulus of elasticity Is 40. (Round your answers to three decimal placa.) (:L:Dm (c) Calculate a prediction interval with a prediction level of 95% for the streng'l nfa single beam whose modulus of elasticity Is 40. (Round your answers to three decimal places.) (l:].l:])ma (d) If a 95% CI Is calculated for true average strength when modulus of elasticity Is so, what will be the simultaneous condence level for both this Interval and the interval calculated In part (b)? The simultaneous condence level for these intervals is at least: '51:. Need Help? :-:'5 Points] ASK YOUR TEACHER PRACTICE ANOTHER An article gave a scatter plot, along with the least squares line, of x = rainfall volume (m3) and y = runoff volume (ms) for a particular location. The simple linear regression model provides a very good t to data on ralnfall and runoff volume (n : 15) glven below. The equation of the least squares line is y : 1.201 + CLEZSBZIX, .r2 : 0377, and s : 5.00. x Y 5 12 14 17 23 30 40 47 55 67 72 81 96 112 127 4 10 14 14 14 24 28 45 39 45 54 71 Ell QB 100 (a) Use the fact that s' : 1.37 when rainfall volume is 40 m3 to predict runoff In a way that conveys inforrnatlon about reliability and precision. (Calculate a 95% PI. Round your answers to two decimal places.) v 3 ( [:1, :1) m Does the resulting interval suggest that precise information about the value of runoff forthls future observation is available? Explain your reasoning. O Yes, precise informatlon is available because the resulting interval Is very wide. 0 Yes, precise informatlon is available because the resulting interval ls very narrow. O No, preclse informatlon is not available because the resulting Interval ls very wide. 0 No, preclse informatlnn is not available because the resulting Interval Is very narrow. (b) Calculate 95% PI for runoff when rainfall is 5!). (Round your answers to two decimal places.) (i:],:])m3 You may need to use the appropriate table in the Appendix of Tables to answer this question. Consider the following data on x - rainfall volume (m3) and y - runoff volume (MB) for a particular location. x 5 12 14 18 23 30 40 52 55 57 72 S]. 96 112 127 y 4 10 13 14 15 25 27 47 33 46 53 72 82 99 100 Use the accompanying Mlnltab output to decide whetherthere is a useful linear relationship between rainfall and runoff. The regression equation is runoff : -1.77 + 0.335 rainfall Predictor Ccef Stdev tiratio p Constant *1.766 2.290 *0.77 0.454 rainfall 0.33519 0.03513 23.74 0.000 s : 5.034 Rsq : 97.7% Rsqiadj) : 97.6% State the appropriate null and alternative hypotheses. Compute the test statlstlc value and find the P-value. (Round your test statistic to two decimal places and your F-value to three decimal places.) \":1 mam-J State the conclusion in the problem context. (Use a - 0.05.) Reject H0. There is a useful linear relationship between runoff and rainfall at the 0.05 level. 0 Reject HI]. There is not a useful linear relationship between runoff and rainfall at the (1.05 level. 0 Fall to reject \"II There Is not a useful linear relationship between runoff and rainfall at the 0.05 level. 0 Fall to reject \"II There Is a useful linear relationship between runoff and rainfall at the 0.05 level. II Calculate a 95% condence interval for the true average change In runoff volume associated with a 1 rn3 increase in rainfall volume. (Round your answers to three decimal places.) (:1.i:1)m3 The following data is representative of that reported in an article with x = burner-area liberation rate (MBtu/hr-ft-) and y = NO, emission rate (ppm): * 100 125 125 150 150 200 200 250 250 300 300 350 400 400 y 140 150 170 200 200 330 270 400 420 440 380 600 610 670 (a) Does the simple linear regression model specify a useful relationship between the two rates? Use the appropriate test procedure to obtain information about the P-value, and then reach a conclusion at significance level 0.01. State the appropriate null and alternative hypotheses. O Ho: B1 = 0 Ha: B1 o O Ho: B1 0 Ha: B1 = 0 Calculate the test statistic and determine the P-value. (Round your test statistic to two decimal places and your P-value to three decimal places.) t = P-value = 0.000 State the conclusion in the problem context. Fail to reject Ho. There is evidence that the model is useful. O Fail to reject Ho. There is no evidence that the model is useful. Reject Ho. There is evidence that the model is useful. O Reject Ho. There is no evidence that the model is useful. (b) Compute a 95% CI for the expected change in emission rate associated with a 10 MBtu/hr-ft increase in liberation rate. (Round your answers to two decimal places.) ppm You may need to use the appropriate table in the Appendix of Tables to answer this question. Need Help? Read It
Step by Step Solution
There are 3 Steps involved in it

Get step-by-step solutions from verified subject matter experts