

Question: 1-5 Linear Regression (Assignment) Name: Algebra 2 Date: Period: Using Linear Data to Make Real World Predictions. Directions: Scan the QR code above to access
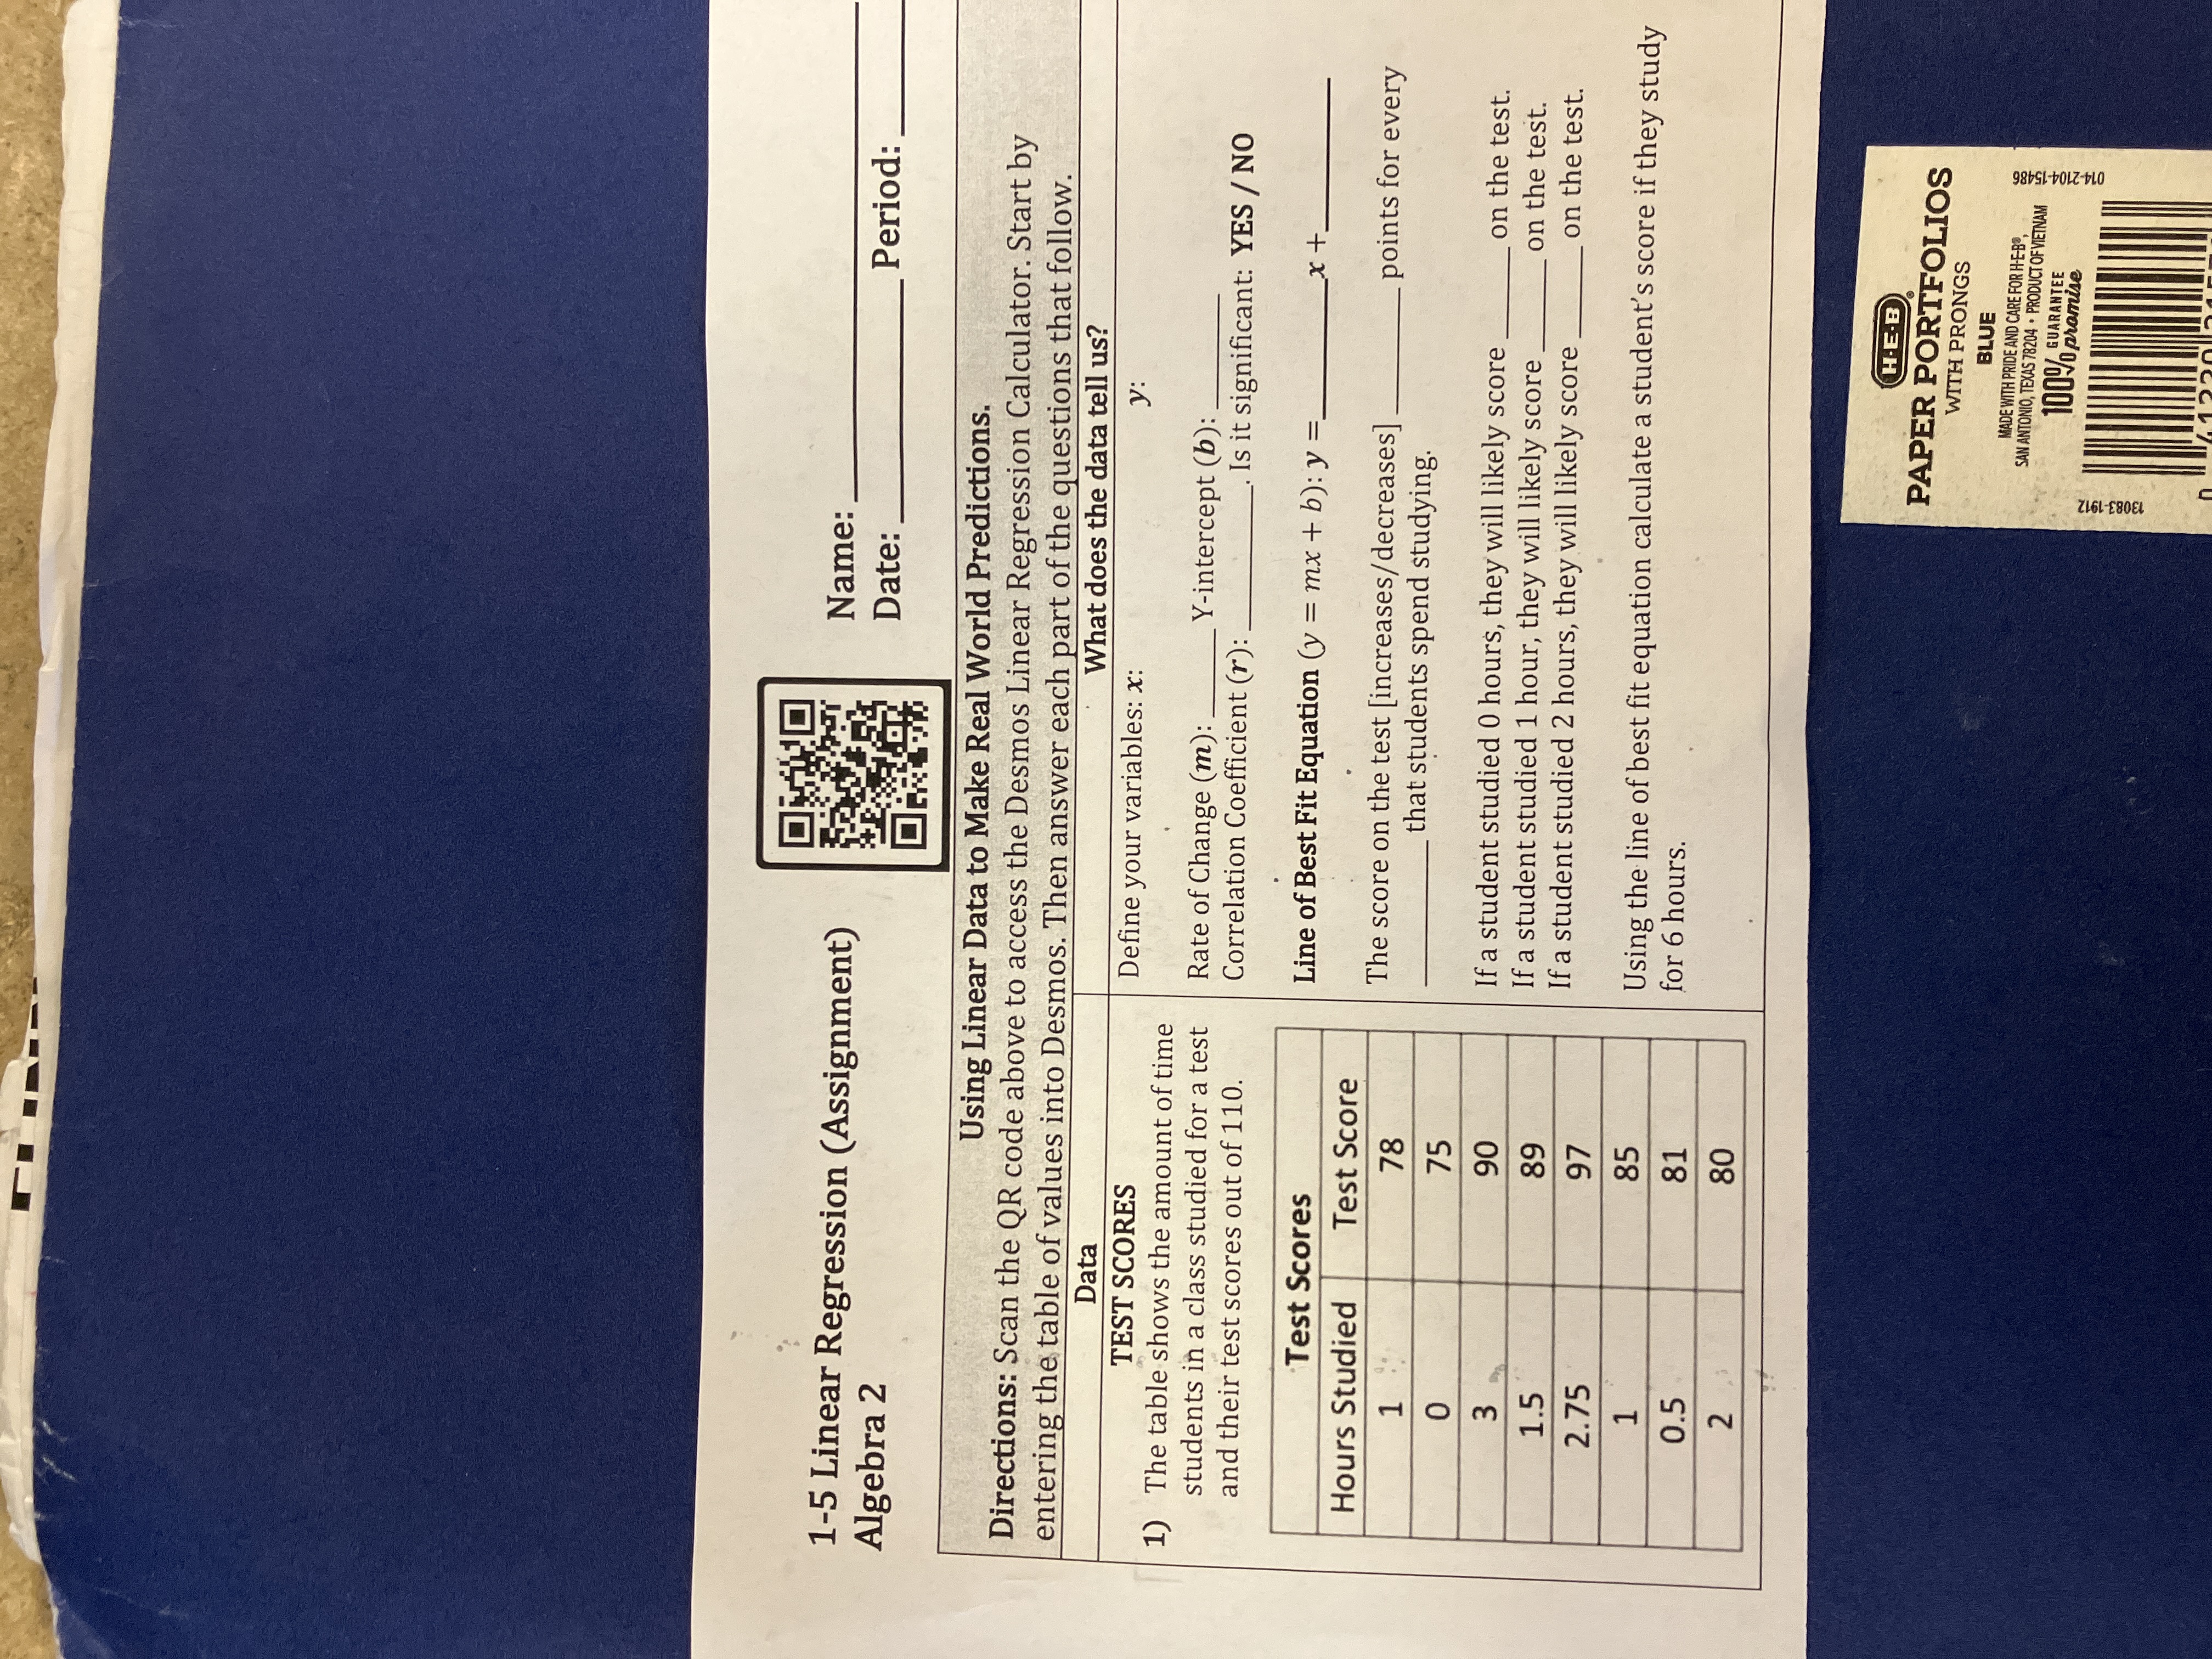

1-5 Linear Regression (Assignment) Name: Algebra 2 Date: Period: Using Linear Data to Make Real World Predictions. Directions: Scan the QR code above to access the Desmos Linear Regression Calculator. Start by entering the table of values into Desmos. Then answer each part of the questions that follow. Data What does the data tell us? TEST SCORES Define your variables: x: y: 1) The table shows the amount of time students in a class studied for a test Rate of Change (m): Y-intercept (b): and their test scores out of 110. Correlation Coefficient (r): Is it significant: YES / NO Test Scores Line of Best Fit Equation (y = mx + b): y =_ x+ Hours Studied Test Score 1 78 The score on the test [increases/ decreases] points for every that students spend studying 0 75 3 90 If a student studied 0 hours, they will likely score on the test. 1.5 89 If a student studied 1 hour, they will likely score on the test If a student studied 2 hours, they will likely score on the test. 2.75 97 1 85 Using the line of best fit equation calculate a student's score if they study 0.5 81 for 6 hours. 2 80 H.E.B PAPER PORTFOLIOS WITH PRONGS BLUE MADE WITH PRIDE AND CARE FOR H-E-B, SAN ANTONIO, TEXAS 78204 . PRODUCT OF VIETNAM 10/ GUARANTEE 014-2104-1548 U.VO promise 13083-1912
Step by Step Solution
There are 3 Steps involved in it

Get step-by-step solutions from verified subject matter experts